There is a noticeable diurnal pattern. There may be a ~15% increase on 12-15/12-16. I don’t see a significant change such as Profile - MagicNTP - NTP Pool Project showed in his first graph.
There are several abusive clients, but these peak at ~hundreds of requests/second.
There were ~5 1N14 requests / second (see arduino NTP library and this)
I didn’t see anything unusual.
@stevesommars, @avij, thanks for your respective analyses! Not sure what your take from this, then, but based on those, I think it might have indeed just a glitch of some DNS server getting stuck with the IP address of my server, as @avij described. But I guess at the end of the day, we’ll probably never know for sure what happened.
@stevesommars, the slight increase on 12-15/12-16 could have been because I took my server out of the pool for a few days. I have now re-added it, but still with lower netspeed than I had it on before I noticed the event that was the main subject of this thread. I might be increasing the netspeed a slight bit further beyond where it is now, but probably not go full throttle again. I’ll think about how to possibly set up some proactive monitoring to perhaps detect, and record, this type of event going forward. Right now, I am only recording short-term peaks, but not those gradual increases. Though it is unclear how likely such an event is to occur again…
Thanks again for your support in investigating this, much appreciated!!
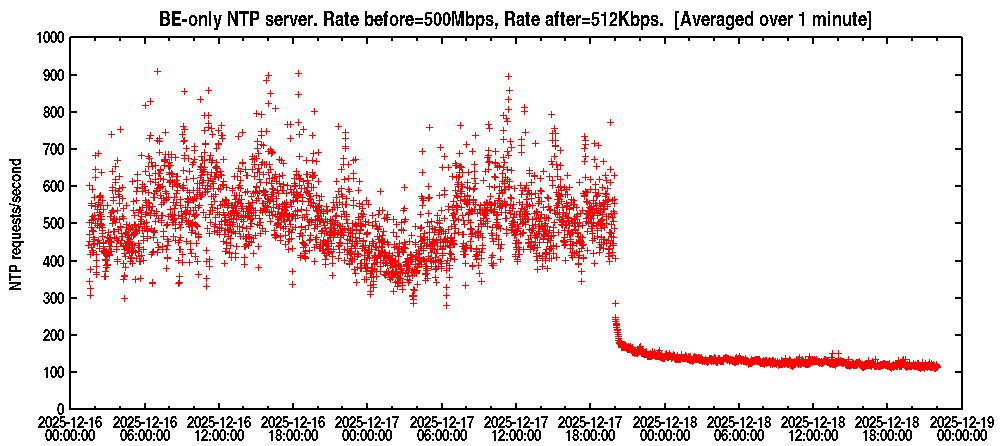
I reduced the rate for my BE server from 500Mbps to 512kbps as of 2025-12-17 20:00
I plan to keep this configuration for at least 24 hours.
The server is in the BE zone. It is not in the EU or global zone.
After the low speed test completes, I plan to configure my BE server to the same rate that Profile - MagicNTP - NTP Pool Project is running. We should get similar rates even though we’re using different counting techniques
@stevesommars, I just increased the netspeed by another notch to 1.5GBit now. But I think that is as far as I’ll go on this one going forward. Had two scares from other providers in the last week, don’t want anyone to get any ideas on this one. And the CPU isn’t the fastest, so I also would like to keep it’s usage in check.
My servers are mostly limited by traffic volume, CPU (hard or fair use), one by bitrate, and only three small ones by packet rate (and there, I don’t even know the actual rate they see/can cope with, I just fiddled with the netspeed until things worked well). That is why I usually measure the load in multiples of bit/s, rather than packets/s.
Anyway, instantaneous packet rate right now is slightly below 3500 packets/s. I think that rate on average would be ok for me in the long run.
I plan to continue for at least another 24 hours, to see if/how the drop-off continues. I don’t see unusual patterns.
Looking at netspeed & rates a bit. Before 500Mbps gave about 500 requests/second. Compared to Profile - MagicNTP - NTP Pool Project 1.5Gbps gave 3500 packets/second. Is that number requests/sec or (requests+responses)/sec ?
It’s incoming only, which now sometimes scratches at, or even briefly exceeds, 4000 requests per second (actually, it is all incoming traffic on the VPS, but NTP is essentially the only thing the instance is doing, and at this rate, NTP is absolutely dominating the traffic mix).
This note contains some conjecture, feel free to suggest corrections.
Clients requests towards a specific server can be divided into two categories:
existing clients Probably did not make a recent DNS lookup.
new clients Probably made a recent DNS lookup that returned the NTP server’s IP address
I won’t go into the factors that differentiate these categories.
Key points: Nothing the NTP pool does will make existing clients disappear. They may persist for days, weeks, even months. The NTP Pool software, the netspeed setting, and the whole DNS hierarchy will affect the rate that new clients appear.
We can coarsely divide the two categories by setting an LRU threshold.
I’ll choose a threshold of 5000 seconds: If a IP address made an NTP request in the previous 5000 seconds it is existing. if not it is new. We can now plot the “new” request rate.
dig +noauthority +noquestion +nostats 0.be.pool.ntp.org

; <<>> DiG 9.18.39-0ubuntu0.24.04.2-Ubuntu <<>> +noauthority +noquestion +nostats 0.be.pool.ntp.org
;; global options: +cmd
;; Got answer:
;; ->>HEADER<<- opcode: QUERY, status: NOERROR, id: 12506
;; flags: qr rd ra; QUERY: 1, ANSWER: 4, AUTHORITY: 0, ADDITIONAL: 1

;; OPT PSEUDOSECTION:
; EDNS: version: 0, flags:; udp: 65494
;; ANSWER SECTION:
0.be.pool.ntp.org.	43	IN	A	193.121.15.225
0.be.pool.ntp.org.	43	IN	A	162.159.200.123
0.be.pool.ntp.org.	43	IN	A	45.87.76.3
0.be.pool.ntp.org.	43	IN	A	178.215.228.24
When you look at the flaqs, it’s missing the aa flag, meaning the results are cached.
Don’t know if this helps. But doing some research on DNS, I came accross this aa flag, what is supposed to mean non-cached.
In the pool result I tested, this flag is missing.
The number before the “IN A” (the 43 in this case) is the number of seconds that it will still cache it and then it will do a new request. It you repeatedly do your query, you will see it decrease to 0 and then it will flush its cache and do a request. I think it is currently set to about 130 seconds validity at a time.
@stevesommars, thanks for the update! I have refined my traffic measuring on this node in the sense that it is now counting packets/second for NTP packets only, and for IPv6 and IPv4 separately. The figure shows what I have been getting since yesterday with a 1.5Gbit setting, though it was still at 1Gbit for a while at the beginning of the graph. Also, the provider seems to be having some networking issues, as visible in the noticeable dips. (Their original business was/is hosting for gaming, which I am now learning seems prone to DDoS attacks, which I seem to get caught in the middle of every now and then…)
In line with that visible increase in packet rate, also the CPU load has been going up a bit, now in an area that I am not comfortable with anymore. To have consistent data between our two measurements, I will not yet reduce the netspeed again right away, though, but wait until you signal that we could do so in concert, or when you are done with your measurements at the current setting.
Generally, while curious as to what is going on - and the involved zones perhaps having a higher share of NTP (vs. SNTP) clients, i.e., not re-resolving often, but rather higher share of existing clients, may be a large part of the explanation - I will not be able to look into this any further through the holidays. And if it remains unclear what exactly is going on, I am happy to also just reduce the netspeed sufficiently to keep the server happy/respect the FUP of the provider (I am lucky to still have some downwards leeway).
Just tested something in my DNS server, when I set my server to TTL=1 then in DIG is shows the counter only doing 0 and 1 no other numbers.
The pool uses 60 seconds as far as I saw.
Maybe the problem is in there? They all are set to 60 seconds? Just guessing.
I was not trying to contradict you, but show you where you can see more information. Yes it is cached, but caching is not wrong or necessarily broken. It is part of the design of DNS. The zone owner/operator can decide how long entries may be cached and do that by adding a TTL value (time to live) for the entries. Down stream DNS servers will receive that value with the address record and will know how long they may cache an entry before doing a new request. If they are not broken, they will adhere to that.
About a week ago i discunnected my IPv6 BE server which was added a few months ago following the high load on BE servers in general and Bas’ server in particular.
Reason for the disconnect was that everything seemed to have calmed down and traffic was at acceptable levels.
Seeing the increased traffic i decided to spin it up again. Unfortunately it needs to be added again to BE zone because of it location it’s only assigned to NL.
I’ve sent an email and awaiting the response.
Using a TTL of 1 will work, but for busy names, like the pool ones, it will add a huge load to the whole DNS infrastructure.
Querying the primary or secondary DNS servers of a zone directly, will produce the aa flag. Basically with that they say that they are authoritative for the zone, ie. there is no upstream DNS server from them for that zone.