Server abuse in Philippines

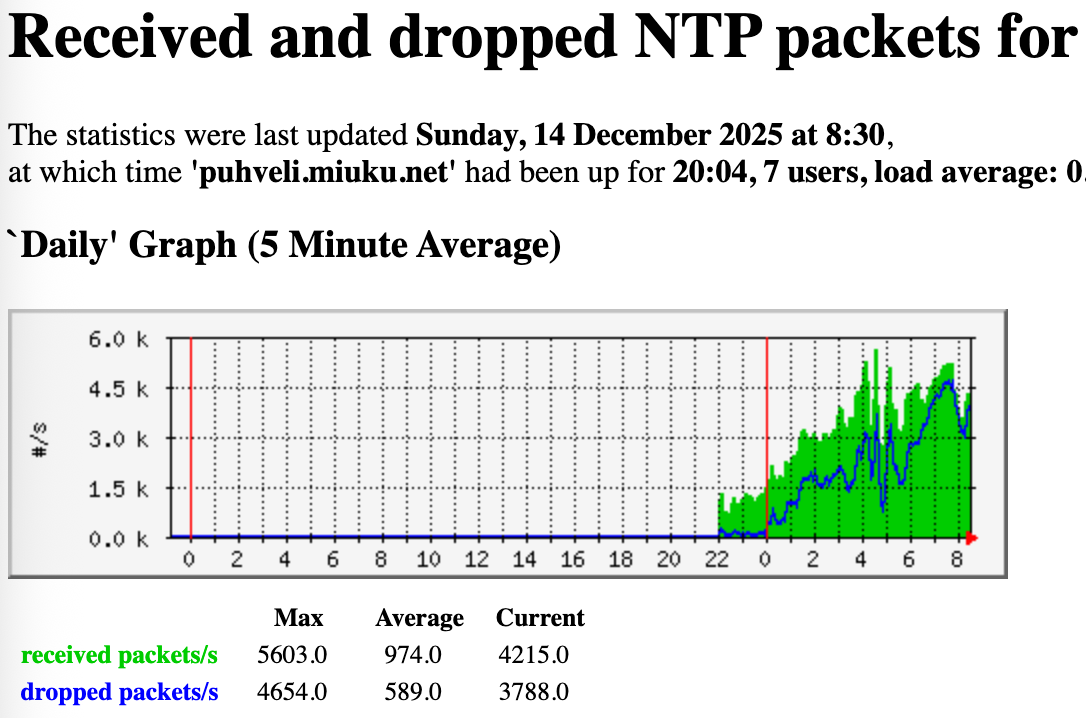
I came to check upon my servers and found out that my VPS in Philippines is suffering too many requests, even beyond the provided bandwidth allocation (30 Mbps). What’s worse, the incoming requests aren’t subsiding after I lowered the speed or dropped completely to monitoring only mode which usually works elsewhere. Stopping chrony makes it even worse. The network graph was suspiciously flat before that too, usually there are some spikes of traffic at certain whole minutes but not here. Did someone just hardcode IP of my server to config of whole ISP? But it’s not one ISP, it’s several from quick check of the most abusive source IPs. Look at it:

chronyc clients -p 10000000
Hostname                      NTP   Drop Int IntL Last     Cmd   Drop Int  Last
===============================================================================
dsl.49.148.156.90.pldt.n>  173041258  12413  -5  -5     0       0      0   -     -
customer.mnlaphl1.pop.st>  26012634  51889  -5  -5     0       0      0   -     -
152.32.90.151.convergeic>  11079607  24249  -5  -5     0       0      0   -     -
143.44.164.103-rev.conve>  610531294  35896  -5  -5     0       0      0   -     -
221.121.96.12              585883306  39976  -5  -5     0       0      0   -     -
222.127.248.227            48055551   6812  -5  -5     0       0      0   -     -
dsl.49.148.143.232.pldt.>  178630730  62955  -5  -5     0       0      0   -     -
216.247.24.180             30503932  35313  -5  -5     0       0      0   -     -
112.208.68.234.pldt.net    89931592  45527  -5  -5     0       0      0   -     -
119.94.108.190.static.pl>  245991730  35968  -5  -5     0       0      0   -     -
dsl.49.149.109.74.pldt.n>  26105255  26588  -5  -5     0       0      0   -     -
138.84.126.219             36496398  51731  -5  -5     0       0      0   -     -
126.209.18.242             33968244  21940  -5  -5     0       0      0   -     -
customer.mnlaphl1.pop.st>  12873982  42708  -5  -5     0       0      0   -     -
150.228.189.18             19686200  36567  -5  -5     0       0      0   -     -
165.99.250.25              87288148  19445  -5  -5     0       0      0   -     -
173.87.29.120-rev.conver>  21062944  36029  -5  -5     0       0      0   -     -
58.69.163.116.pldt.net     35736402  33794  -5  -5     0       0      0   -     -
138.84.115.193             56171978  35733  -5  -5     0       0      0   -     -
dsl.49.144.194.107.pldt.>  46044192  34481  -5  -5     0       0      0   -     -
138.84.114.216             10480342  57686  -5  -5     0       0      0   -     -
120.28.194.245             11423169  22707  -5  -5     0       0      0   -     -
180.190.7.125              40073423  17689  -5  -5     0       0      0   -     -
dsl.49.148.227.91.pldt.n>  18104657  35843  -5  -5     0       0      0   -     -
196.79.158.136.convergei>  20587174  54135  -5  -5     0       0      0   -     -
32.83.158.136.convergeic>  11273016  31335  -5  -5     0       0      0   -     -
120.28.194.14              62105389  21907  -5  -5     0       0      0   -     -
143.44.196.16-rev.conver>  15534873  58877  -5  -5     0       0      0   -     -
139.135.192.168.converge>  101897193  10607  -5  -5     0       0      0   -     -
dsl.49.145.208.242.pldt.>  25932534  24984  -5  -5     0       0      0   -     -
dsl.49.149.205.220.pldt.>  180861011  57512  -5  -5     0       0      0   -     -
120.28.199.153             14405156  28541  -5  -5     0       0      0   -     -
112.200.160.90.pldt.net    225447547   3134  -5  -5     0       0      0   -     -
103.161.61.77              376803247  10680  -5  -5     0       0      0   -     -
150.228.189.242            15093627  22217  -5  -5     0       0      0   -     -
139.135.77.238             50047575  20703  -5  -5     0       0      0   -     -
dsl.49.149.99.232.pldt.n>  12527978  47221  -5  -4     0       0      0   -     -
203.177.193.196            38676294  22509  -5  -5     0       0      0   -     -
103.91.142.72              24573736  39882  -5  -5     0       0      0   -     -
126.209.13.45              89343040  16204  -5  -5     0       0      0   -     -
180.195.158.118            28361202  18941  -5  -5     0       0      0   -     -
222.127.169.33             27864001  31288  -5  -5     0       0      0   -     -

Normal traffic

After turning down the netspeed:

After putting server in monitoring mode and stopping chrony:

It would help if you show the pool-server page to all of us.

I bet the served %% is way high,

It’s this one but already in monitoring mode: pool.ntp.org: Statistics for 165.154.233.197

1 Like

Your answer is here:

Client distribution

Global points 3.66‱
Top Countries
ph 355.22 ‱
id 3.40 ‱
br 0.39 ‱
cn 0.29 ‱
vn 1.41 ‱

And your speed-setting isn’t the lowest one: Zones: asia ph

As you show Asia as well.

Then see here: pool.ntp.org: NTP Servers in Philippines, ph.pool.ntp.org just a few servers…so YES your server is getting a lot of requests.

Those a high numbers. It’s a bug in the pool-dns-distribution, reported many times, including by me for Belgium.

@ask We hope it will be fixed soon, else servers will stop joining the pool.

I noticed the same, as do many others.

Set your speed to 512kbit for now, it may help.

As I wrote, the server isn’t currently participating in the pool, in dns queries, it’s set as monitoring only. The stats are irrelevant at this moment. Yet the incoming traffic isn’t getting any smaller.

Was it ever in he pool? As it takes days to weeks to get rid of all clients.

It won’t change overnight.

Sure it takes time but usually in my experience clients start to drop soon after lowering the netspeed. Not all but noticeable portion of them, even in high demand zones. Too bad many or most clients don’t respect KOD or dropped packets.

Hi @jnd

Yes having a server in the Philippines can be an “interesting” experience. I have had one for a number of months that has always been on the lowest speed setting and it gets hammered with incoming requests. The vnstat monthly figures -

The hosting company does not seem to mind all this incoming traffic so I have just left it running. The server replies to about 140 million requests per day and drops millions of requests each hour. Some ip addresses are sending thousands of requests per second from the same ip and source port - no idea why but they hit the firewall and get dropped.

A solution to the “problem”? Not sure I have one. The best thing I have found, as you are doing, is to keep the speed setting low so your incoming traffic does not completely fill the port speed and therefore block the monitor tests. Apart from that I am not sure there is much else that can be done.

@ask, the solution to the problem is that the pool needs to divide the load to other servers that serve region or worldwide.
But it doesn’t. Because of this BUG countries with few servers are hit hard, very hard.
In fact, I wish you could select countries that you want to serve as well, like I have a lot of servers, but I can’t make them to join Belgium where the same problem happens.

In my opinion there should be a threshold on numbers where other servers are included.
So far this only happens for Country and World, as far as I can see…all others are ignored.

I got hammered too, I know the feeling. Ask should fix this soon. Servers should not be overloaded with requests…and YES he knows as the numbers SHOW IT. Please fix this soon.

The pool is flawed for this. I want several servers to join BE, mailed a lot, they are not serving BE.

It’s simply not cool to keep hammering servers.

Something that may be of interest to anyone reading this thread -

My server in Manila does a DNS lookup to various servers of pool.ntp.org every 15 minutes and stores the results. Looking through the output I can see that a number of the ip addresses returned are outside the Philippines (based on the round trip times recorded).

For example the last 40 results from a lookup with the fields being

Unix Time, Server doing the DNS lookup, ip address the lookup was sent to, DNS named looked up, ip address returned, round trip time to that ip address (-1 = no response)

$ cat 2025-12*ph-l1-pool-dns.csv | grep -v asia.pool | tail -n 40
1765495404,ph-mnl-l1,127.0.0.1,pool.ntp.org,222.127.1.24,-1
1765495404,ph-mnl-l1,127.0.0.1,pool.ntp.org,162.159.200.123,1
1765495404,ph-mnl-l1,127.0.0.1,pool.ntp.org,222.127.1.21,-1
1765495404,ph-mnl-l1,127.0.0.1,pool.ntp.org,162.159.200.1,1
1765495404,ph-mnl-l1,1.1.1.1,pool.ntp.org,222.127.1.24,-1
1765495404,ph-mnl-l1,1.1.1.1,pool.ntp.org,162.159.200.123,1
1765495404,ph-mnl-l1,1.1.1.1,pool.ntp.org,222.127.1.21,-1
1765495404,ph-mnl-l1,1.1.1.1,pool.ntp.org,162.159.200.1,1
1765495404,ph-mnl-l1,8.8.8.8,pool.ntp.org,160.119.216.202,312
1765495404,ph-mnl-l1,8.8.8.8,pool.ntp.org,196.10.54.57,238
1765495404,ph-mnl-l1,8.8.8.8,pool.ntp.org,102.64.113.152,379
1765495404,ph-mnl-l1,8.8.8.8,pool.ntp.org,102.130.49.195,145
1765495404,ph-mnl-l1,9.9.9.9,pool.ntp.org,58.71.12.13,24
1765495404,ph-mnl-l1,9.9.9.9,pool.ntp.org,222.127.1.18,-1
1765495404,ph-mnl-l1,9.9.9.9,pool.ntp.org,162.159.200.1,1
1765495404,ph-mnl-l1,9.9.9.9,pool.ntp.org,162.159.200.123,1
1765495404,ph-mnl-l1,104.248.145.172,pool.ntp.org,162.159.200.1,1
1765495404,ph-mnl-l1,104.248.145.172,pool.ntp.org,162.159.200.123,1
1765495404,ph-mnl-l1,104.248.145.172,pool.ntp.org,58.71.12.13,24
1765495404,ph-mnl-l1,104.248.145.172,pool.ntp.org,165.154.233.197,18
1765496637,ph-mnl-l1,127.0.0.1,pool.ntp.org,58.71.12.13,23
1765496637,ph-mnl-l1,127.0.0.1,pool.ntp.org,162.159.200.123,1
1765496637,ph-mnl-l1,127.0.0.1,pool.ntp.org,162.159.200.1,1
1765496637,ph-mnl-l1,127.0.0.1,pool.ntp.org,222.127.1.22,-1
1765496637,ph-mnl-l1,1.1.1.1,pool.ntp.org,162.159.200.1,1
1765496637,ph-mnl-l1,1.1.1.1,pool.ntp.org,58.71.12.13,23
1765496637,ph-mnl-l1,1.1.1.1,pool.ntp.org,222.127.1.23,-1
1765496637,ph-mnl-l1,1.1.1.1,pool.ntp.org,162.159.200.123,1
1765496637,ph-mnl-l1,8.8.8.8,pool.ntp.org,198.137.202.32,184
1765496637,ph-mnl-l1,8.8.8.8,pool.ntp.org,162.159.200.123,1
1765496637,ph-mnl-l1,8.8.8.8,pool.ntp.org,66.187.4.132,195
1765496637,ph-mnl-l1,8.8.8.8,pool.ntp.org,138.89.14.60,-1
1765496637,ph-mnl-l1,9.9.9.9,pool.ntp.org,58.71.12.13,23
1765496637,ph-mnl-l1,9.9.9.9,pool.ntp.org,222.127.4.114,19
1765496637,ph-mnl-l1,9.9.9.9,pool.ntp.org,162.159.200.1,1
1765496637,ph-mnl-l1,9.9.9.9,pool.ntp.org,162.159.200.123,1
1765496637,ph-mnl-l1,104.248.145.172,pool.ntp.org,162.159.200.123,1
1765496637,ph-mnl-l1,104.248.145.172,pool.ntp.org,162.159.200.1,1
1765496637,ph-mnl-l1,104.248.145.172,pool.ntp.org,58.71.12.13,23
1765496637,ph-mnl-l1,104.248.145.172,pool.ntp.org,165.154.233.197,17

You will notice that Google (8.8.8.8) tends to return the most non Philippines servers so I guess it depends on who you ask for a pool ip.

And to @jnd your server appears in the top 10 but not at the top

$ cat 2025-12*ph-l1-pool-dns.csv | grep -v asia.pool | awk -F, '{print $5}' | sort | uniq -c | sort -rn
    286 162.159.200.1
    281 162.159.200.123
    182 58.71.12.13
    103 222.127.4.114
     53 165.154.233.197
     28 222.127.1.24
     27 222.127.1.23

First, I would suggest waiting a few days to see if the situation improves. Yes, in many regions the traffic will drop very quickly when the netspeed setting is reduced, but not all the regions are the same.

If the number of requests slows down with your current “monitoring only” mode you could try to raise the netspeed to 512 Kbit/s again to see if the network traffic is tolerable at that setting.

There have been rare cases in the past where the pool has “stuck” to serving the same set of NTP server IP addresses for a few hours, due to backend database problems or similar. However, I don’t see an indication of this in my own statistics right now, so this is probably not the case here.

Another source of non-pool NTP traffic might be that someone has added your NTP server’s IP address to some other DNS name, like ntp.example.com. It’s hard to figure out if this is the case, but as you seem to be running a HTTP server you could check your web server’s logs if there are bot requests to some unexpected hostnames (ie. apart from *.pool.ntp.org, which should have stopped at around the time you switched to “monitoring only” mode). Sure, NTP and HTTP are entirely different protocols, but sometimes the HTTP server logs can give hints about these kind of oddities.

I set up a server in PH so I wouldn’t miss the fun. Various stats can be found from its own webpage. I may adjust the netspeed settings up and down in the next few days, so take all the stats with a grain of salt. I’m aiming for something like 4TB/month of sent traffic, and as of now it looks like I could increase the netspeed significantly. I’m doing the increases gradually as a precaution.

As for received traffic, it’s indeed fairly wild. I can confirm some observations. Dropping away from the pool (either by setting the monitoring mode or otherwise) does not reduce the incoming traffic, at least immediately. During the warmup period my server reached the score 10 threshold and got added to the pool. Then the pool shuffled some monitors between Testing and Candidate lists (so that the Testing monitors had lower RTT values), causing the recent median score to momentarily drop slightly below 10. This is all fine, it’s how the algorithm works. As of now the situation has stabilized and my server’s score will be consistently 10+ from now on.

The above gave me an opportunity to observe what happens when the server gets removed from the pool. I have some graphs for you, from the time just prior to getting re-added to the pool:


The above graph shows when the server got dropped from the pool at around 06:15 UTC. Note how the incoming traffic did not drop.


The above graph shows the wild percentage of dropped requests, which even increased when the server was not in the pool.

I’m currently using “ratelimit interval 3 burst 8 leak 4” configuration in chrony to limit the rates.

Note that I have my usual “if an ICMP unreachable is received, don’t send any responses to that IP address for 100 seconds” firewall rule in place, so not all the requests sent to my server are recorded in chrony’s NTP request graphs. The effect of this firewall rule does not seem to be particularly significant in PH. Maybe around 1.5% of requests get dropped because of this.

I can also confirm the observation of some clients sending zillions of requests from the same source port. I captured 1M packets to/from UDP port 123 when the server was out of the pool and here are the top ip/port combinations:

cut -d" " -f3 ph_idle.txt | sort | uniq -c | sort -rn | head
 238085 49.145.240.186.28380
 235615 120.28.252.60.21366
 214157 103.235.92.193.17744
  98625 120.28.200.206.53751
  93355 45.115.225.48.123 (this server, this row was expected)
  79616 124.217.19.122.9939
     34 136.158.10.187.31883
     34 126.209.21.163.39952
     34 112.210.150.62.1461
     34 112.209.74.13.21897

If you want to have a look at this pcap file, it’s available at https://miuku.net/tmp/ph_idle.pcap.gz
I don’t know if these oddities are the result of a bug or just maliciously forged source IP addresses.

Edit: For comparison, here’s a similar 1M packet capture when the server was in the pool: https://miuku.net/tmp/ph_active.pcap.gz

I must say I’m a little bit concerned about the percentage of dropped packets, but on the other hand, the pool monitors seem to be happy so I suppose it’s okay.

1 Like

All true. I don’t think the pool needs any changes because of this situation. Getting rid of the abusive clients (or forged source IP addresses) would be nice, though, but that’s not directly in our control.

1 Like

I don’t think it’s unrealistic to request that monitors not use the pool to find sources (e.g. use pool DNS names in their configuration). That’s not to say never use any servers which are in the pool, rather, pool monitors should manually maintain a configuration of good upstream sources that may include, for example, Cloudflare’s anycast servers.

2 Likes

Yes, indeed. But my point was not about using pool names. The pool discourages that already for servers.

But rather, my point was about monitors, which have kind of the role of referees in the system, so should have some degree of impartiality, and independence from the pool. That impartiality/independence could be questioned when the monitors themselves get their own time, as one basis for judging servers, from (some of) the servers they are supposed to judge impartially, even when hand-picked and configured statically. :slightly_smiling_face:

Indeed in my opnion the monitors should get their time directly from multiple stratum 0 sources backed up by very reliable sources and using a long holdover time (good OXCO, Rb or Cs source). And have the monitors check the correct time against other monitors.

But the monitor (agent) software continuously check its time against 12 ipv4 and 8 ipv6 ntp servers and pause its operation when its time seems out, so does it really matter?

Also your own monitor does not “judge” your own ntp servers, so you can use them at least?

They do. Like mine via GSP+PPS, being stratum 1.

Monitors beging 0 is impossible, as the load on them would be immense.

Monitors are checked against reliable servers. As such the monitors are not the problem.

The problem is the pool, @ask , the pool should make big servers join smaller servers, yet it doesn’t.

I takes global servers, it takes country servers, but anything between…meaning EU/ASIA/etc seems to be ignored.

As such undeserved country servers are being hit hard, very hard. This got NOTHING to do with the monitors, they do their job.

It has everything to do with a bug in the ntppool system that doesn’t distribute load fairly over servers that are not local/global…all in between seem to be ignored.

Ergo and EU server won’t serve Belgium…that is the problem, a Global does.
Plenty EU servers, yet BE-lgium is undeserved.

The same problem hits others. This is a POOL-BUG!

Coming back to the Philippines problem. I had a look at the traffic and looks like nothing has changed since stevesommars examined the packet capture last year. The excessive traffic looks like a bug.

2 Likes

I spent this evening writing a script that captures a 10-minute chunk of the traffic (defined by time but typically it’s going to be around 1.5 - 2 GB), then finds the top offenders from the capture file. Then the script extracts and gzips per-ip pcap files for each top offender from the main capture file, to be used as evidence. This is in crontab, executed weekly on a certain day of the week at night, because it takes a while to process the capture files.

Once this is done, another script crafts an abuse report for each offender IP address, grouped by the abuse email address. Details include timestamp, source and target IP addresses and ports, number of total requests, average request rate and a link to the pcap file of that IP address. I could make the script actually send the emails as well, but for now I’ll keep myself in the loop and copy+paste+send the emails myself.

At least I’m trying to do something for this situation. I’ll keep sending the emails weekly until the situation gets better.

For the record, I’m now also dropping some traffic at the firewall level. If some IP address sends more than a million requests per hour, requests from that IP address will be limited to 50/sec at the firewall for the next week (and further restricted by chrony’s ratelimit setting). This change shows as reduced dropped packets in my graphs, but sadly the incoming network traffic graphs remain unaffected, as expected.

1 Like