General statistics questions

Dear All,
since years I have some NTP servers in the AT pool for IPv6. As we changed the IP address I had to remove the old IPs and create new entries for the pool. This caused me to look into the statistics again.
For example one of my server pool.ntp.org: Statistics for 2001:67c:1b70:80::80:29 , for this I see Global points 2.26‱ . What does it mean ? Does it say that for 0.0226 % of all DNS queries as answer this server IP is sent back ?
Also not clear for me are the top countries
at 342.57 ‱ 396.47 ‱ (0.86x)
de 1.06 ‱
us 0.07 ‱
Does it say that 3.42 % of DNS queries coming from Austria ? Could be as there are only 24 servers for IPv6. So this fits quite well. And Germany is used by 0.0106 %
But when I check the most recently used list for the last hour it looks completely different:

About two-thirds of traffic is coming from Austria and one quarter (23.5%) is coming from our neighbours. This relation is a big mismatch against the statistics what the web page says. Any explanation for this ? But probably I don’t understand the statistics.

Last question: what does it mean “The second number is the server’s permyriad of the overall “netspeed” for countries configured for the server.” ? In my case factor 0.86

Kind regards
Hans

Hans, I have no clue either.

What we do know by now is that the DNS-handing-out-NTP-servers-pool is flauwed a lot.

As Belgium was underserved, some servers wanted to join, they got massive numbers of requests.

The DNS of the pool has major problems and need to be fixed.

See my topic. You are not the only one that asks this question.

@ask please fix the DNS problem….it’s not funny….some servers are hit real hard, others not.

See here: https://community.ntppool.org/t/i-take-a-big-hit-in-queries

Not sure exactly what you mean, so apologies if the following is what you meant:

From all the DNS queries coming from clients that the pool thinks they are in Austria, your server will be included in responses to ~3.42% of those queries.

From all the DNS queries coming from clients that the pool thinks they are in Germany, your server will be included in responses to ~0.01% of those queries.

As there are somewhat more clients in Germany than there are in Austria, and thus also more queries from those clients, respectively, the actual traffic one sees is skewed. I.e., larger share from Germany than the above numbers would suggest.

Your server is configured for Austria, that is why it has three values for Austria only. The other lines are countries that are not assigned to your server, thus netspeed value doesn’t make sense, and fraction between DNS query fraction and netspeed fraction doesn’t exist.

The first permyriad value for Austria is the fraction of DNS queries with the address of your server in it that come from clients that the pool thinks are in Austria in comparison to all queries the pool sees from Austria (see my previous post above).

And the second permyriad value, which exists for Austria only, is what fraction the netspeed you have set for your server is in relation to the sum of all netspeeds of all servers configured for that same country.

The last number is the relation of the two permyriad values, i.e., the factor 0.86 in your case. This value compares the share that you should get based on the netspeed setting of your server in relation to the sum of all netspeed settings, vs. the share of actual DNS queries (as rough indicator of actual NTP traffic) you get from the country (or more precisely, queries to which the pool’s response contains your server’s IP address).

In “healthy” zones, in my experience, the fraction often tends to be slightly below 1. Large deviations from 1 indicate some “issue” (not necessarily problematic) with the zone.

E.g., when there are just two servers in a zone, one with 3Gbit, the other with 512Kbit, the latter will typically get a fraction much larger than one (indicating it gets much more traffic than what its share of the overall sum of netspeed values would suggest), because the load sharing simply does not work with two servers only. Thus, the ratio of the two permyriad values will be somewhat larger than 1.

Or could just be because the two values are taken at different timescales: The netspeed fraction is near instantaneous (some caching delay in the system maybe), i.e., a value at one instant in time. The DNS fraction on the other hand is the average accumulated over several days. I.e., after a netspeed change, it will take some time until the new netspeed share will also be reflected in the DNS share. Or some other, “big” server vanishes, or is added, resulting in an “immediate” change in other servers’ netspeed share, but DNS shares will take time to adjust. (@avij references the explanation for the different timescales in a parallel thread.)

I think the value of slightly below 1 for “healthy” zones is because some of the queries from that zone go to other zones. I.e., the sum of queries from a zone going to that zone is slightly smaller than the sum of all queries from that zone. (That is why you see DNS permyriad values for other countries: Those are “leaking” from the respective other zones to the Austria zone, i.e., clients from Germany and the USA (and probably other countries, but in numbers too small to appear in the list) that get responses with your server’s IP address in them. The other way round, when you query the pool from your IP address in Austria and get the IP address of a server in Switzerland (e.g., because you query for the named country or continent zone, rather than the “global” zone, that would contribute to that Swiss server’s permyriad value for queries from Austria.)

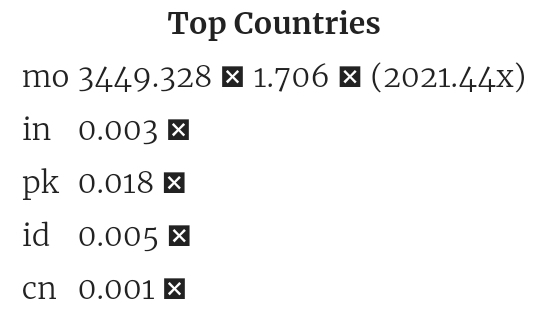
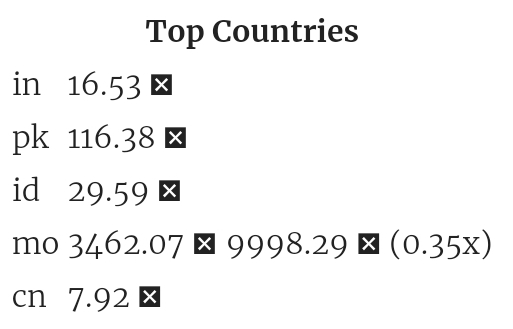
By the way, maybe adding some additional confusion: The lines are sorted by absolute number of DNS queries from the respective countries that are answered with your server’s IP address. I.e., could be, e.g., that the DNS permyriad value of the second line is larger than the DNS permyriad value of the first line, because the absolute number of queries from the country in the first line answered with your server’s IP address is larger than the absolute number of queries from the country in the second line that have been answered with your server’s IP address in the response.

E.g., the following:

Screenshot from 2025-10-16 18-26-24

This server gets more queries from clients in the US zone than from the ID zone in absolute numbers, that is why the US line is above the ID line. But from among all the queries from each respective country, this server gets a fraction of queries in the US zone (0.0265%) in comparison to all queries from the US zone that is smaller than the fraction of queries it gets from the ID zone in comparison to all queries from the ID zone (0.3087%).

4 Likes

Wow, amazing explanation.
Shows you have some knowledge of the system, lol
Please see anoher example of one of my servers officially serving NL as well as BE zones.
This server is included in 5% of DNS requests from BE zone and represents 5% of bandwidth in BE zone. So, nicely balanced :wink:

Interestingly, the same server (with the same bandwidth ofcourse) represents just 0.6% of the bandwidth in NL zone and is included in 0.4% of DNS requests from NL zone. This is a direct result of a considerable difference in no of servers in NL and BE.

The other factor here is the netspeed value distribution across the server population. E.g., if a particular server has a low netspeed value, then a small number of other servers with larger netspeed values may have a similar impact on the server’s netspeed share as a large number of other servers with netspeed values similarly small as the specific server’s value.

Interesting the factors between the two ratios: Slightly above one for BE, which I think might come from some servers being overloaded and potentially phasing in and out of the DNS rotation. I.e., their “instantaneous” netspeed value is what it is, but they accumulate less DNS queries over time. This is reflected in > 1 ratios for servers that are in the pool constantly. At least that was my explanation for an even greater imbalance in the SG zone, where there were a few servers with high netspeed but phasing in and out of the pool, so their DNS share was low (and ratio below 1), While others were more balanced, i.e., always in the DNS rotation, so they accumulated a way higher DNS share than their netspeed share would suggest.

In the NL zone on the other hand, the ratio value noticeably below 1 shows it is well-served, but also that a lot of traffic is “leaking” to other zones: Even though my server in the NL zone (and now also BE) is not in the DE zone, the share of actual traffic from DE is much higher than it is for NL. Even now, DE traffic is about five times as much as NL or BE traffic (though I am counting individual clients, not packets, but with IPv6, those numbers should be more closely related than for IPv4, where different scales of CGNAT deployments in different zones might skew that relationship differently).

2 Likes

i don’t understand how such a leaking scenario (of higher DE traffic than BE/NL) can exist since your server is not even part of DE zone…

I faintly remember that some popular product in Germany was (is?) by default configured not only with the DE zone, but also with one or two other zones as backup, I think NL and maybe GB (rather than the global zone - though given that the DE zone is anything but underserved, that wouldn’t have been a problem for a local rather than global product, unlike in other parts of the world). Or some (older) recipes for configuring NTP clients suggesting to set things up that way.

1 Like

Hi MagicNTP

yes, I mean the same. ( But your English is better than mine )

I agree partly, Germany has about 9 times more residents than Austria has. As there is almost the same level of technology and wealth, we can expect, there are about 9 times more DNS queries generated in Germany. But DE has currently 445 IPv6 servers and AT has only 23 for IPv6. Therefore Germany has about 19 times more NTP server than Austria which gives about a two times better client / server relation for Germany. So no reason to use Austrian servers for Germany. ( It should not create the impression that I am against Germany. )

I can understand that German clients also use Austrian NTP servers because maybe some big Internet providers with million installations in German households have a configuration to use also AT pools as backup. But then it should be reflected in DNS statistics, isn’t it ?

// Hans

Hello Hans,

No, there is not. But the pool cannot prescribe to people how they are to configure their NTP clients.

Also, just as your server was originally misplaced in Germany if I remember correctly, so could other clients be. When they get configured to use the named AT zone, e.g., because of some default configuration of products designed specifically for the local market, or because the user notices that servers from the DE zone are being accessed rather than from the AT zone, they will obviously be counted as clients from the DE zone.

What would you expect to be different?

By the way, the raw data currently is 1549176 queries from AT, and 40104 from DE. I.e., 38 times as many queries from AT than from DE. Or about 2.5% of the sum of queries from AT and DE combined come from DE, if I got the math right.

Hi MagicNTP

I really appreciate your very detailed information and the time you investigate to inform the community. Many thanks.
I think, now I have it.
Such a detailed explanation should be available in the web page because I think, I am not the only one who does not understand the currently available short information on the web.

Kind regards
Hans

1 Like

Hi MagicNTP

man thanks for your swift feedback again.
I would expect, that the relation of DNS queries between AT and DE would reflect in a similar value to the relation for NTP queries coming from AT and DE.
For my initial posting yesterday I used Map IP Address Data with IPinfo API Tools - IPinfo.io to generate the map and statistics. To verify the result now I wrote my own shell script to analyse the geolocation. And I got very similar results as ipinfo. Not worth mentioning the difference.
As you wrote about the “raw data currently” I extracted again the data from ntpd. I took the mrulist from this NTP server 2001:67c:1b70:80::80:29 from the last hour. I configured mru for just one hour therefore I don’t have more data back in the past. With the new data I get similar result as yesterday:
total entries: 123293 100%
AT 92346 74.9 %
DE 28487 23.10 %
rest 2460 1.99 %
ipinfo.io has again a very similar result.
Your current raw data are 1549176 queries. So mine are less than 8% of amount. Are your data just my server or is it the complete AT pool ? And what is the time periode ?

Kind regards
Hans

Thanks a lot for the explenation. All clear.

But I also noticed that my friend TimeTeam in Leuven, who has a webpage that counts clients to be served.

After the servers where added to Belgium his numbers dropped from ~33K to ~23K, see yourself:

That means that adding servers has a big impact on our tiny country.

Thanks a lot guy’s. Also my home-server is working well, no problems so far with my router.:ok_hand:

1 Like

Hello Hans,

This is a field that needs much further study. In general, I think there should be some correlation between the two, but it could just as well be that there is a noticeable discrepancy.

E.g., depending on what DNS resolver services are predominantly used in a specific country, mostly ISP-provided ones, or more of the global open resolver services. In the former case, many clients could be fed by a very small number of DNS resolver instances the same cached DNS response while it is valid, leading to the DNS volume underrepresenting the actual NTP traffic volume. In the latter case, with the typical anycast setup of those services actually hiding that there is a multitude of independent server instances each with their own cache, and with multiple such services available, each with their own proprietary internal setup and inner workings, this could generate a higher level of DNS queries seen, and counted by the pool.

And some of those global open resolvers support user privacy, i.e., it is more difficult for the pool to assess the actual location of a client. This increases the risk of “misplacing” the NTP clients country-wise, e.g., when the DNS request is routed to an anycast instance in another country, the pool is likely to count it as coming from the country the DNS server instance is located in, rather than the client.

And some ISP DNS resolvers mess with the lifetime of cached DNS reponses. E.g., Alibaba Cloud for some reason sets the TTL to 10 seconds in all responses, regardless of the value sent by the origin. I don’t know whether the resolver itself also caches responses only for ten seconds. Either way, that is bound to probably skew the relation between number of DNS queries, and actual NTP traffic, in some way for zones with Alibaba Cloud locations, as compared to other zones.

Or what type of NTP client implementation is prevalent in a country. SNTP clients tend to create more DNS traffic in relation to NTP traffic they create than NTP clients, so if the predominant type of device in one country has one type of client in it, and the predominant type of device in another country has the other type of client in it, that is bound to skew the results in one way or another.

So, many factors playing a role, making it difficult to determine exactly how the number of DNS queries correlates with the amount of NTP traffic, many open questions, thus interesting observations that are difficult to explain, e.g. why the predominant IPv6 NTP traffic for both my NL as well as LT server is from Germany (in terms of number of individual clients, not traffic volume). (By the way, traffic from Austria is second on my LT instance, while traffic from Lithuania itself is only in seventh place - though all with veeery low IPv6 NTP traffic overall.) Or why, as I understand it, you are seeing a higher proportion of actual traffic from DE than the DNS query counts would suggest.

It is just for your server, as collected by the pool.

See this explanation.

How to find out about such interesting APIs? For instance, I’d love to find out which servers or countries my monitors are polling periodically and sporadically.

I found this particular one by studying the code. I think some things might be documented, spread across various places. E.g., I think there was a post not long ago pointing to various places of documentation regarding the new monitoring approach. And I think somewhere, in a post and/or some documentation, access to some backend database using Google BigQuery (?) was discussed. Not sure though the info you refer to is accessible/documented.

Just to highlight this, I looked at a snapshot of 10000 incoming IPv6 NTP requests, and looked at the distribution regarding source country for the number of unique clients/IP addresses (which I mostly use), and contrasted that with the number of packets from each country (portions from countries not mentioned omitted):

Source country Share of # of packets Share of unique IPv6 addresses
BE 21% 14%
NL 22% 22%
DE 48% 55%

If I did the math right, and copied everything properly, and my interpretation is correct, that would mean that clients from Belgium on average send more requests per client than clients from Germany (though a much larger number of samples would be needed to make a statistically sound statement on that).

I.e., illustrating one aspect of how traffic in different zones is different, making it difficult to precisely derive one kind of metric from another, and even more difficult to try to derive a universally valid correlation between different metrics.

1 Like

Hi MagicNTP,

many thanks for your very useful feedback.
I agree that there are a lot of factors we do not know.
Related to the DNS caching. The average of “avgint” for those clients which is not zero is about 1600. The TTL for DNS for at.pool.ntp.org. seems to be 130 seconds. Therefore each NTP request should result in front of in a DNS query ( if the client handles DNS well ) because it times out after the last query.

Speaking about anycast. I checked DNS at ripe for 2.at.pool.ntp.org. ( see result in RIPE Atlas - RIPE Network Coordination Centre ) . Based on RTT < 10ms I would guess there are anycast DNS servers in EU, US and Australia. Is this true ? Do you see the logs from all of them or just one ?

Since years I did have 3 IPv6 NTP servers in the AT-pool as the coverage for IPv6 was really poor years ago. With 3 servers I covered 20% of AT-IPv6 servers. Since some weeks there are only 2 of mine in AT-pool. But I have totally 4 pieces of stratum-2 servers and also own stratum-1 servers. So I put yesterday one server into the AT-pool with IPv4 ( pool.ntp.org: Statistics for 147.125.80.160 ) I started with extrem low net-speed which I will increase later. Just to see if this behaviour is for IPv4 the same. What I can say now is the fact that the relation of NTP requests for AT:DE is about 10:1 in opposite for IPv6 where it was 2:1 ( and both are of course in the AT-pool. ) But probably one day is too short, maybe in two weeks I know more. And as you said in one of the previous postings this load balancing may not work correctly with this low net-speed.

Thanks about the information about Lithuania, it’s interesting.

So what we can finally say is the fact that the information on the web could be wrong. The real numbers we can only see on the network or in the “mrulist”.

Kind regards
Hans

Hello Hans

The “NTP part” of an NTP client can hold on to the IP address well beyond the DNS TTL. See, e.g., the “warning” on the pool pages that even once a server is removed from the pool, traffic may take a long time to fully stop (it will be reduced significantly, but some clients may still stick around even for months or even years). Or, e.g., the challenge with the classic ntpd daemon, which sticks to an IP address even when the server ceases to exist. (chronyd will routinely switch IP addresses after some time even when the server still responds under the address, in addition to switching more rapidly when a server becomes unavailable.)

I was referring to the resolver, e.g., Quad9, Cloudflare, Google. The pool’s servers are not using anycast in my understanding, but rather “normal” DNS mechanisms to share the load. I.e., multiple names for the nameservers, e.g., a.ntpns.org, b.ntpns.org, etc. And each of them points to multiple IP addresses. (Not sure whether maybe the pool uses its own GeoDNS mechanisms also for finding the closest DNS server instances, i.e., IP addresses, for a given nameserver name, similar to how it does it with the NTP servers. Though I think there are far less DNS server instances, so even less coverage in large parts of the world, so the current strict GeoDNS approach would be even less useful than for serving NTP server addresses.)

I am not part of the pool staff, so I don’t have access to any logs. Except select views as exposed via APIs for use in public-facing pool functions, e.g., the share of DNS queries shown on a server’s page.

I didn’t do the math for an exact number, but made a similar observation on my server in NL, that traffic from DE by far outnumbers local traffic for IPv6, while local traffic from NL (plus now also from BE) is more than an order of magnitude larger than traffic from DE with IPv4. Maybe different levels of IPv6 adoption in different countries, combined with the unequal treatment of IPv6 by the pool, plays a role here.

I wouldn’t say it doesn’t work “correctly” anymore. The relation between netspeed and actual traffic simply isn’t strictly linear anymore, or not even with higher netspeeds. But even that depends very much on number of servers in a zone, their respective netspeed settings, and the number of clients in the zone.

The basic challenge is that a netspeed setting vs. sum of overall netspeeds results in a fraction/decimal value with theoretically almost infinite resolution, while a DNS response can only carry whole IP addresses, not fractions thereof. Thus the fraction needs to be approximated by how frequently the IP address of a server is put into a DNS response at discrete points in time. This is more precise for larger values than for lower ones. And it also works better with a larger number of servers. In the extreme, if there are just two servers in a zone, the pool will typically put those two IP addresses into every DNS response, mostly regardless of their repective netspeed settings. (Though in cases I’ve seen, the DNS share sometimes was less than 50%, but I have yet to figure out why.) And it works better with a larger number of clients, as the higher frequency of providing DNS responses that could potentially carry a server’s IP address leads to higher “resolution” of the process of mapping a continuous value onto the distribution of a set of discrete instances in time. And caching also distorts the picture, as it means an IP address with a smaller netspeed value could potentially be handed out to more clients than would be its share based on netspeed. For larger netspeed values, where IP addresses are handed out more often anyhow, caching is less distorting.

Again, I wouldn’t say the information is “wrong”. It is just more complex than a simple linear relationship, and one simply needs to be aware of that when working with, and trying to interpret those numbers.

Here’s a nice example for IPv6: