Is there way to find out in general how many IPv4 and v6 requests the pool (or parts of it) is receiving? Even better if there is change over time stats.
Thanks
Is there way to find out in general how many IPv4 and v6 requests the pool (or parts of it) is receiving? Even better if there is change over time stats.
Thanks
I’ve looked into this in the past, and my main finding was: it depends on where you are. Some countries generate significantly more IPv6 queries than others. For example, in Germany, the CPE manufacturer AVM has configured 2.pool.ntp.org (the only NTP Pool hostname with AAAA records) as the default in their popular Fritz!Box devices. This has led to a noticeable increase in IPv6-based queries.
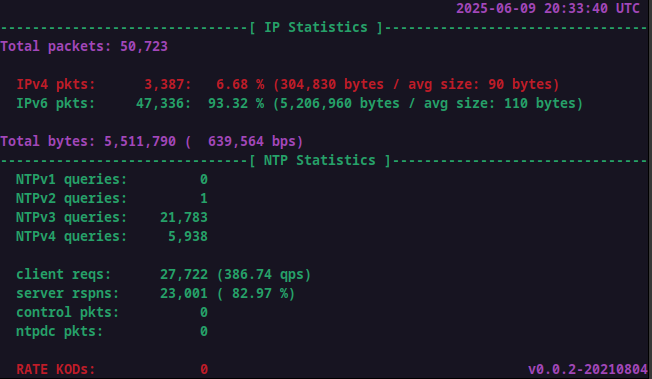
I’ve written a small tool that provides a live view of IPv6 vs IPv4 traffic:
![]() ntptools/ntptraf2 at main · mdavids/ntptools · GitHub
ntptools/ntptraf2 at main · mdavids/ntptools · GitHub
For longer-term statistics, you might want to refer to:
Although these resources are not specifically focused on the NTP Pool, they do give a good sense of what might be possible if all NTP Pool hostnames had AAAA records — rather than just one.
Perhaps looking at incoming AAAA DNS queries at the authoritative server level would confirm these statistics, but I’m not able to do that.
Oh neat! A few minutes on one of my servers in Norway with maxed netspeed setting:
Afaik, all the major consumer ISPs in Norway have IPv6
After a Ctrl+C:
Some closing stats:
Applied filter: 'udp and port 123'
IPv4 bytes: 131,044,192 (89.327 %), IPv6 bytes: 19,129,440 (10.673 %).
Starttime: Mon Jun  2 01:59:47 2025
  Endtime: Mon Jun  2 02:11:46 2025
Total number of packets: 1,629,280.
IPv4: 1,455,376 packets, IPv6: 173,904 packets.
Goodbye!
Oh dear… The percentage could’ve been so much higher if only @ask were be willing to add more AAAA records to the pool… ![]()
Rough estimate: you’re only seeing about a quarter of what’s potentially possible — so 44% would actually be achievable?
A quarter is quite pessimistic, not counting the many hosts that use only pool.ntp.org with the pool directive, which never returns AAAA records.
What bothers me most is that @ask usually remains silent nowadays on the IPv6 topic…
Yes, I believe @ask should enable AAAA in at least one more server, not only 2, perhaps 0 and 2 for now. The pool has the servers:
| IPv4 | IPv6 | |
|---|---|---|
| Total | 3479 | 1930 |
| Africa | 61 | 37 |
| Asia | 259 | 180 |
| Europe | 2272 | 1211 |
| North America | 731 | 410 |
| Oceania | 117 | 81 |
| South America | 53 | 27 |
This is the split for IPv4 vs IPv6, the drop is the graph is due to a maintenance restart this morning.
This is across all 3 servers in the NZ / Oceania region
Thanks, in general, the trend appears to be 90% PIv4 and 10% IPv6 regardless of where in the world you are. And that is kind of strange since Costa Rica has about 13% capable IPv6 connections and New Zealand 32% and Norway 44%. I just need more data to see if there is a relationship between IPv6 capability of a country an how many v6 queries the servers in that country are getting.
I see about the same 90/10 ratio for multiple servers hosted in Germany where google sees an IPv6 adoption rate of like73%.
I chalk that up to just 2.pool having AAAA adresses and many devices just using pool. and therefore not getting any IPv6 adresses.
Concurring view for Germany:
UK (50.43% IPv6 adoption rate according to Google):
Spain (13.74% IPv6 adoption rate according to Google):
Here is some more data, from France (which, according to Google, has a staggering 85% IPv6 adoption rate). Please note that there is some bias in favor of IPv6 in this case: In order to maximize utilization of my traffic volume quota, the netspeed setting for IPv6 usually is 2.5 times that of IPv4. For comparison purposes, I reduced the IPv6 netspeed setting to match the one for IPv4 well over 24 hours ago, but there obviously still is some residual IPv6 traffic in addition to the traffic due to the current netspeed setting.
Another example, illustrating that the topic of underserved zones also has a bearing on the ratio between IPv4 and IPv6 traffic rates, from a zone in Asia with an IPv6 adoption rate (as per Google) just slightly lower than that of Germany. It has six healthy IPv4 servers, i.e., all six have been active pretty much ever since I joined the zone over the week-end. On the IPv6 side, there’s a total of four servers. As far as I could ascertain so far, three of them keep fading in and out of the zone for most of the busier part of the day, with the typical saw tooth pattern of overloaded servers. I.e., mine was apparently the only one active all the time, occasionally joined by one of the others. This effectively disables the netspeed setting, no matter how low it is set, with the following impressive result regarding IPv6 to IPv4 traffic volume ratio (at identical netspeed settings for IPv4 and IPv6):
When I remove my server from the zone, the IPv6 traffic will peter out somewhat. The screenshot below is shortly before I had the server rejoin the zone once the IPv4 traffic slightly surpassed the IPv6 traffic, after which IPv6 traffic jumped right back up again to earlier levels.
Now, a bit into the less busy period of the day, overall traffic has gone down enough for more of the other IPv6 servers to be active for longer. For short periods of time, there’s even all four active. The most recent period was too short for me to take another screenshot in time, but even with two servers active, due to the overall lower load, the ratio is slightly less skewed. But probably still not a realistic reflection of the actual relative traffic shares.
Good point! I do that too, for all my IPv6 enabled servers.Thanks for pointing this out.
In Belgium, where we have roughly the same amount of IPv6-enabled NTP servers and IPv4 ones, we get about 1/3 IPv6 traffic. My own server that has both IPv4 and IPv6 gets about 800 packets/s for IPv4 and 200 packets/s for IPv6 (it’s set to 1 Gbps relative to others in the pool, for both IPv4/6)
While I’m pretty well resigned to the status quo, I still hold out some hope that whatever is motivating the IPv4 favoritism will change as uptake continues and old software fades slowly away.
Same here. Though unless something changes, first we’ll have to first sit through a (needlessly) painful phase where CGNAT keeps breaking things in the IPv4 pool more and more. Makes you wonder why, really.
I should have paid more attention to the repository… I received a PR weeks ago that I only just confirmed. Even though it’s a small fix, it’s a very good catch, because it closes an issue that had been open for years. ![]()
You may want to grab the source again and recompile.
Many thanks to the submitter of the PR!
I noticed that my firewall is dropping a lot more IPv6 packets than v4 ones, so it seems more devices that have v6 are misbehaving. My firewall is set to drop packets to a client if it sends 100 packets/s or more with a burst of 115 packets. This is set for both v4 and v6. Looking at the iptables/ip6tables I get 52 packets dropped for v4 and 17160 for v6, even though I’m getting more than half less v6 connections vs v4.
What other filtering do you have activated on the fw?
Could it be that some filtering for spamhaus or GeoIP is activated for IPv4, but not for IPv6?
No other than this and only for udp port 123. There are some blocked IPv4 IPs but only for tcp 443