I’m finishing the last pieces of the Infrastructure move announced a couple of months ago today. NTP and DNS service will work as usual, but the management website will be unavailable for a period while the database is migrated and the application starts up in the new cluster.
4 Likes
Good luck with those final steps of the migration!
2 Likes
I didn’t check if validating / verifying a server works, but otherwise I believe most pieces are in place in the new system!
Congrats on the successful completion of the migration, and many thanks for the hard work!
One minor thing I recently also noted on the beta site: With multiple accounts, the switching between them via the drop-down in the left side panel does’t seem to work. The URL changes, reflecting the account ID, but the page doesn’t change, which keeps showing the servers from the “default”/first account. With monitors, it’s similar, except the URL does not reflect the chosen account ID.
2 Likes
Many monitors show last connection to have been around 7:41 UTC, with one having this in the logs:
2026-04-26T08:14:45.890399901Z time=2026-04-26T08:14:45.890Z level=INFO msg="detected certificate/connection error, flushing connection pool" pool-flusher.url=https://api.mon.ntppool.dev/monitor.v2.MonitorService/GetConfig pool-flusher.error="remote error: tls: bad certificate" pool-flusher.status=0 pool-flusher.trace_id=58a444bc43dcb7ab456a1a731d139101 pool-flusher.span_id=919c9ddb40e04227
2026-04-26T08:14:45.893775274Z time=2026-04-26T08:14:45.893Z level=INFO msg="detected certificate/connection error, flushing connection pool" pool-flusher.url=https://api.mon.ntppool.dev/monitor.v2.MonitorService/GetConfig pool-flusher.error="remote error: tls: bad certificate" pool-flusher.status=0 pool-flusher.trace_id=f6d8d00acb282b67d6a6d05f15f2ae66 pool-flusher.span_id=6a675e72a8f44928
2026-04-26T08:14:46.143955154Z time=2026-04-26T08:14:46.143Z level=ERROR msg="could not get config, http error" env=prod ip_version=v4 err="unavailable: net/http: HTTP/1.x transport connection broken: http: ContentLength=14 with Body length 0" monitor_ip=xyz
2026-04-26T08:14:46.144078130Z time=2026-04-26T08:14:46.144Z level=WARN msg="fetching config" env=prod ip_version=v4 monitor_ip=xyz err="unavailable: net/http: HTTP/1.x transport connection broken: http: ContentLength=14 with Body length 0" monitor_ip=xyz
2026-04-26T08:14:46.148082520Z time=2026-04-26T08:14:46.147Z level=ERROR msg="could not get config, http error" env=prod ip_version=v6 err="unavailable: net/http: HTTP/1.x transport connection broken: http: ContentLength=22 with Body length 0" monitor_ip=abc
2026-04-26T08:14:46.148196134Z time=2026-04-26T08:14:46.148Z level=WARN msg="fetching config" env=prod ip_version=v6 monitor_ip=abc err="unavailable: net/http: HTTP/1.x transport connection broken: http: ContentLength=22 with Body length 0" monitor_ip=abc
2026-04-26T08:18:26.144887490Z time=2026-04-26T08:18:26.144Z level=INFO msg="getting client configuration with BaseChecks for LocalOK" env=prod ip_version=v4 monitor_ip=xyz errors=22
2026-04-26T08:18:26.149283781Z time=2026-04-26T08:18:26.149Z level=INFO msg="getting client configuration with BaseChecks for LocalOK" env=prod ip_version=v6 monitor_ip=abc errors=22
2026-04-26T08:18:26.393167067Z time=2026-04-26T08:18:26.392Z level=INFO msg="detected certificate/connection error, flushing connection pool" pool-flusher.url=https://api.mon.ntppool.dev/monitor.v2.MonitorService/GetConfig pool-flusher.error="remote error: tls: bad certificate" pool-flusher.status=0 pool-flusher.trace_id=240517ed4c7c7061adb1345e6bdafa63 pool-flusher.span_id=e6cc85d1fd3231c9
2026-04-26T08:18:26.399329312Z time=2026-04-26T08:18:26.398Z level=INFO msg="detected certificate/connection error, flushing connection pool" pool-flusher.url=https://api.mon.ntppool.dev/monitor.v2.MonitorService/GetConfig pool-flusher.error="remote error: tls: bad certificate" pool-flusher.status=0 pool-flusher.trace_id=a13d7c5a7c5beabf57954b8fa3f01391 pool-flusher.span_id=bdcfbb28c8303027
2026-04-26T08:18:26.504034994Z time=2026-04-26T08:18:26.503Z level=ERROR msg="could not get config, http error" env=prod ip_version=v6 err="unavailable: net/http: HTTP/1.x transport connection broken: http: ContentLength=22 with Body length 0" monitor_ip=abc
2026-04-26T08:18:26.504593946Z time=2026-04-26T08:18:26.504Z level=WARN msg="fetching config" env=prod ip_version=v6 monitor_ip=abc err="unavailable: net/http: HTTP/1.x transport connection broken: http: ContentLength=22 with Body length 0" monitor_ip=abc
2026-04-26T08:18:26.511727453Z time=2026-04-26T08:18:26.511Z level=ERROR msg="could not get config, http error" env=prod ip_version=v4 err="unavailable: net/http: HTTP/1.x transport connection broken: http: ContentLength=14 with Body length 0" monitor_ip=xyz
2026-04-26T08:18:26.512171685Z time=2026-04-26T08:18:26.512Z level=WARN msg="fetching config" env=prod ip_version=v4 monitor_ip=xyz err="unavailable: net/http: HTTP/1.x transport connection broken: http: ContentLength=14 with Body length 0" monitor_ip=xyz
It looks as if the certificate’s Subject Name is empty, which should’t be a problem, as the SAN matches api.mon.ntppool.dev. Except I am currently not sure whether there is a difference between an empty Subject, and no Subject at all (only SANs). (Or maybe that distinction is just an artefact of how openssl renders a decoded certificate.)
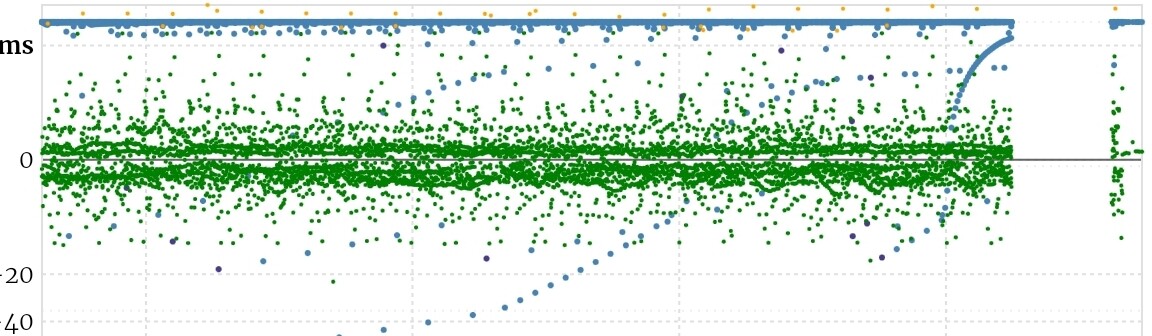
This could also be the reason why new registrations currently fail, not least because the implicit NTP check of the prospective server, fails, just as an explicit NTP check via the portal function: Too few monitors available to execute those checks, as well as the regular monitor checks, as also reflected in the score graphs: After a while of no checks at at (during the migration I guess), checks seem to resume as normal, before the number of checks seems to dtop dignificantly:
But they might be picking up again already:

Pretty much all my probes are connected again ![]() .
.
I fixed the account switcher just now; and as you noticed the SAN in the API certificate.
The database is acting extra slow, I think that’s what making the rate of monitoring probes lower than usual. I’ll look into it in more detail later today.
1 Like
Yes, switching between accounts works again, thanks!
Currently, https://www.ntppool.org/dns.html is giving me an “Error 503 first byte timeout” from the cache server.
On the monitoring, to me, it looks more than just a little bit less than normal, with the status page showing mostly around 1500 checks/second right now, while “normal” would be ten times that. But it’s working in general, so indeed not totally pressing.
The dns.html page has been fixed! (Really that page needs to get updated to work from prometheus metrics or something else; it made more sense when there were much less servers!)
2 Likes
Thanks!
Once I have a better understanding of the back-end systems currently feeding this, and those you refer to, I’ll be happy to look into updating this page.
This topic was automatically closed 21 days after the last reply. New replies are no longer allowed.