Every now and then, I get the following message instead of the expected statistics in the “Client distribution” section of a server’s details page (e.g., this server as of right now):
Metrics error: Unexpected token ‘<’, “<bod”… is not valid JSON
Haven’t found a pattern yet as to when this is happening/what this happening might correlate with/be caused by. I guess the metrics back-end or some reverse proxy in front of it is returning an HTML-baeed error page instead of the expected metric data in plain JSON format, but don’t know why.
During previous instances, the pool systems’ status page showed that something was not right in the back-end systems, but everything looking fine this time around.
Woah, you were quick! I didn’t realize anyone were looking at those metrics. That API was gone for I think less than an hour.
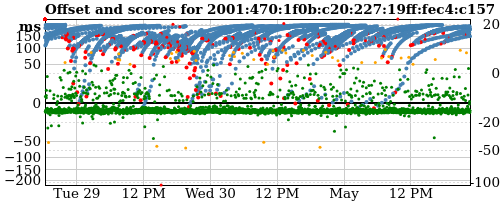
I’ve been moving some of the metrics and stats APIs to a Go based service. The “client distribution” API was the first prototype of it and today I upgraded the production site to get some improvements I made yesterday. Specifically the legacy graph image (using your server as the example since you linked to it already) doesn’t go through the Perl based website anymore at all.
Next up will be the CSV and JSON logs as those are some of the next slowest parts of the website.
I addedOpenTelemetry to the website which has been helpful figuring out what’s slow, and identifying sporadic or complex errors.
Thanks for the additional troubleshooting, and confirming it was a wider issue.
Ok, thanks for the explanation!
I did not previously pay much attention to them, just noticed every now and then getting the described error message. Happened to be looking into the metrics in more detail in the past days, thus decided to raise this this time around.
Oh, I thought I had given it a bit of time after first noticing it, to see whether it was a transient issue that would resolve itself after some time. Didn’t realize it was less than an hour from first noticing this till raising the topic . Didn’t mean to be too impatient.
Since you all noticed the previous upgrade; the API for returning recent scores has also been upgraded. It should return exactly the same data as before and the old URLs should work, but it’s MUCH faster.
The old URLs as such do work, as far as I can see. However, when accessing them via browser, the behavior has changed: In the past, the log data was displayed directly in the browser.
Now, accessing the URL embedded in the server details page via browser leads to the download of a log.csv file. I tried this in multiple different browsers/on multiple different devices, and the behavior is the same, i.e., the change in behavior doesn’t seem caused by a change on my end. Rather, I guess this might be caused by a change in the MIME type of the log data on the server side (Content-Type is now set to text/csv, not sure what it was before).
@ask: Would it be possible to get the old behavior back?
For accessing the URLs via curl or wget, e.g., for more detailed analysis, it doesn’t make a difference. Also, as before, it would still be possible to download as a file via browser, if so desired, by saving the displayed log data into a file.
However, the requirement to first download the log file before being able to view with a separate app/program makes it more difficult to get a quick glance at the log data.
E.g., on some of the mobile devices I typically use for day-to-day monitoring, this would require installation of a suitable separate viewer. And in any case, manual removal of each temporarily downloaded file after viewing (vs. displaying the text directly in the browser) would be required, which is annoying if all one wants is take a quick look at the data only.
Many thanks, @ask, both for changing it back as well as the quick response!
Looking good, i.e., confirming that the data is showing directly in the browser again in different browsers/on different platforms for quick peek at the data.