Had a server running on the local net, dedicated host, for about a year, but tried to add the ip address in the manage servers tab and get the above message. Fixed ip and it can be accessed externally, so wonder what the issue could be ?..
Thanks, The address is: 81.133.34.141. This has been tested from another system 50 miles away. Have a 4g modem that I will set up this morning to verify from here as well. Setup has been working on a local subnet for about a year and seems stable…
Tried to register again today and was accepted. Meantime, found I
could access via another route, so looks like problem solved.
A bit of info on the setup:
Using a dedicated machine for the server, a low cost micro atx
box with two network ports, one internet facing, other for a
private server subnet. Running FreeBSD 12 and rebuilt kernel for
pps input via the serial port, but pretty much stock other wise.
Internal subnet has 2 older gps time servers, a Truetime NTS100 and
a Time Tools 95??, with PPS from one or the other. Both sourced
from the usual site as spares / repair and fixed up. Have been
playing with this for about a year now before putting online,
but seems pretty solid.
All started > a decade ago with a need for an accurate frequency
standard for the lab, and the time nuttery has grown from that.
Typical output from ntpq -pn at the time server is:
root@ntp-host:/etc # ntpq -pn
remote refid st t when poll reach delay offset jitter
o127.127.22.0 .PPS. 1 l 6 8 377 0.000 0.000 0.001
*xxx.9.200.168 .GPS. 1 u 2 64 377 0.195 -0.002 0.054
+xxx.9.200.169 .GPS. 1 u 13 64 377 0.329 -0.007 0.038
-81.174.133.68 .PPS. 1 u 60 64 377 20.937 1.122 4.351
-194.80.204.184 .GPS. 1 u 14 64 377 18.584 -1.054 0.202
+158.43.128.33 .GPS. 1 u 52 64 377 16.199 0.023 0.448
Sorry, didn’t format right, but top 3 lines are local, while
the rest are all external stratum 1 servers, as recommended…
Been subscribed and running for a couple of weeks or so. Seems to be working, with up to 200 hits per minute max in some cases. Having difficulty understanding the monitoring scores though. Occasionally get to 10 or 11, but soon falls back, a typical graph (today)
This is typical for the whole time subscribed. Have been trying to do a bit of debugging. Another machine has an ntp.conf and ntpq -pn logging data for plotting. Typical ntpq -pn output is:
*10.0.100.125    .PPS.            1 u   20   64  377    0.280    0.053   0.043
+81.133.34.141   .PPS.            1 u   15   64  377    2.555    0.294   0.062
-217.114.59.3    157.44.176.4     2 u   77   64  352   16.073    0.673   0.316
-109.74.206.120  129.69.1.153     2 u   19   64  257   10.346    0.737   0.112
-185.103.119.60  194.80.204.184   2 u   24   64   63    9.855    0.629   0.128
-129.250.35.250  249.224.99.213   2 u   20   64  257    9.791    0.456   0.073
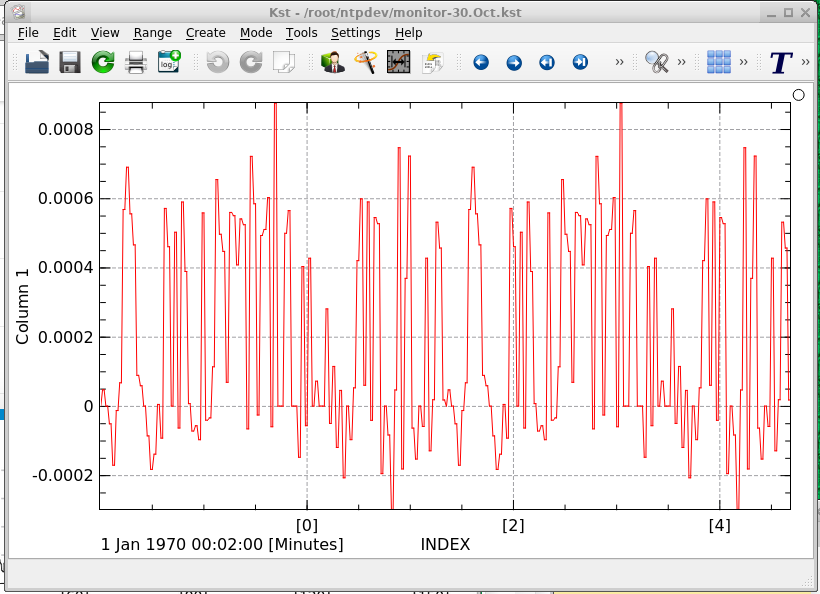
Top line is at the ntp server machine interface, second is the external fixed ip and the other four are the uk pool hosts. Continuously plotting offset and jitter produces:
Lower trace is offset, upper is jitter, index in tens of minutes. Although logging external address is only a few hops, a couple of ms delay, offset is < 0.6mS worst case.
Looking at the ntp pool monitor data there are 26 failed reads in 24 hours or so, with offset values plotted as:
Focus on the particular client, 90.218.229.222:
18:17:19.396648 IP 90.218.229.222.ntp > bt-inner.aerosys.ntp: NTPv4, Client, length 48
18:17:19.397041 IP bt-inner.aerosys.ntp > 90.218.229.222.ntp: NTPv4, Server, length 48
18:17:19.422256 IP 90.218.229.222.ntp > bt-inner.aerosys.ntp: NTPv4, Client, length 48
18:17:20.397384 IP 90.218.229.222.ntp > bt-inner.aerosys.ntp: NTPv4, Client, length 48
18:17:21.397657 IP 90.218.229.222.ntp > bt-inner.aerosys.ntp: NTPv4, Client, length 48
When requests from a single client arrive too closely together (here it was 1 second or less) the server may respond with ALARM, RATE. It may also silently drop the request.
Thanks. kod is enabled in the server ntp.conf, so may be a possibility. Also have firewall rules enabled, so will try disabling that and reboot, divide and rule etc. Expect a bit of debugging for this, just trying to get an idea of what is at fault, but the offsets look ok at the monitor and 1 read miss per hour / 24 hours would be expected for udp, so what is causing the very fast demerits on score ?. The data does not seem to support that…
Another thing noticed this morning was off the screen rate of client requests, hundreds per second, from 194.83.132.3, but nslookup can’t find it. Now blocked in the firewall, but no idea what that was about ?. dos perhaps ?..
The Newark NTP pool monitor sees many misses, maybe 35%. Server kod may account for a few, but I suspect loss in the IP network is likely. We’ve seen this again and again between Newark and Europe/UK Telia and Zayo are often the cause of NTP loss.
That begs the question, why Newark, or are there no monitors in other regions ?. Would make sense, to minimise path delay and jitter, to associate servers in a region with monitoring in that region. Are there monitors in regions other than the US, or is that work in progress ?..
Looking at the data, the only time client requests are dropped is when (as you hinted) there are multiple packets in a short time frame. Otherwise, every packet gets a reply. Scores seem to have improved a lot overnight however, but no idea why.
i used ntpdate -d 81.133.34.141 from 3 differnet locations here in germany and got only timeouts / no responses.
I would suggest to set the ntppool speed to the lowest value (384kbit) if you haven’t done this already.
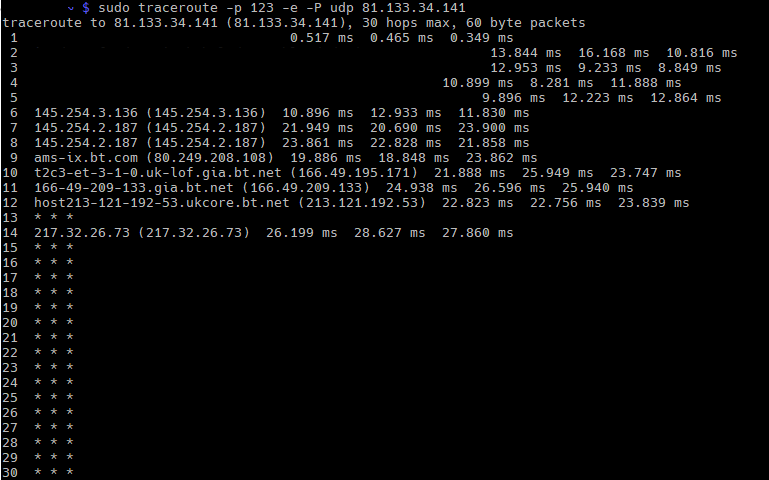
Also i would suggest to run some traceroutes from different lcoations to your server. Maybe some people from the forum can do that if you don’t have the opportunity.
Not clear why that doesn’t work, but haven’t found traceroute to be that reliable, often not completing anyway. I’ll try running a script from an external host to see how many replies get dropped, but so far, from logging, every client request is answered, other than multiples from the same ip, possibly kod. If it’s not reachable from anywhere in Germany, suggests a network problem and not much that can be done about that. Network speed is set to 1 meg, which the system here should handle without issues.
The monitor data downloaded rom Newark looks ok, with good offset margin and the i/o timeouts just 26 or so in > 24 hours, which doesn’t look that bad for UDP, but doesn’t appear to do retries. Whatever, seems like there is more going on in monitoring than is obvious…
The net speed setting should probably be shown as some kind of multiple rather than an absolute rate. This is what the help text says:
Server settings
The net speed is used to balance the load between the pool servers. If your server can handle more or you’d like less NTP requests, you can adjust this value. The query load to your IP should adjust within 10-30 minutes.
This speed does not mean the wire speed of your server, it’s just a relative value to other servers.
The amount of queries your server will get is generally directly proportional to the netspeed, so a 50Mbit setting will get about 5 times more traffic than the 10Mbit setting. Be aware that the amount of queries to your server will grow over time.
It works from this end and the server gets requests and send replies all day long, so a traceroute problem ?. traceroute may not complete for all kinds of reasons unrelated to server accessability.
Since this is a monitoring problem, not a server issue, wonder if it would help to delete the server from the list and register with the beta site, which appears to have more region specific monitoring ?.
Having said that, if I download the monitor data and analyse, the server is always within 1mS offset, with few dropouts, so is there a doc on the monitor algorithm ?..