Ntppool-agent v4.0.5

In v4 we’re using the MQTT connection less, so I didn’t notice (though monitoring was squeaking!) that I broke the client connectivity. It is used for the “ad hoc NTP check” feature and for the first sanity check when adding a monitor, so that breaks when there are no more v3.8.6 monitors.

Upgrading to v4.0.5 fixes it (I upgraded a few monitors so the features above should work again).

Thanks to @msiegen for reporting this.

3 Likes

@ask was the build for 4.0.5 uploaded? I do not see it on Index of /ntppool-agent/builds/release

1 Like

For “yum” users it seems to be available in the ntppool-test repository only.

Maybe https://builds.ntppool.dev/ntppool-agent/builds/test/579/checksums.txt helps?

Whoops – @avij is right it’s only in the testing repository. I forgot to hit “publish” to promote it as a proper build. It should be in the repositories now, and on

1 Like

Up and running IPv4 only. Tell me what you expect.

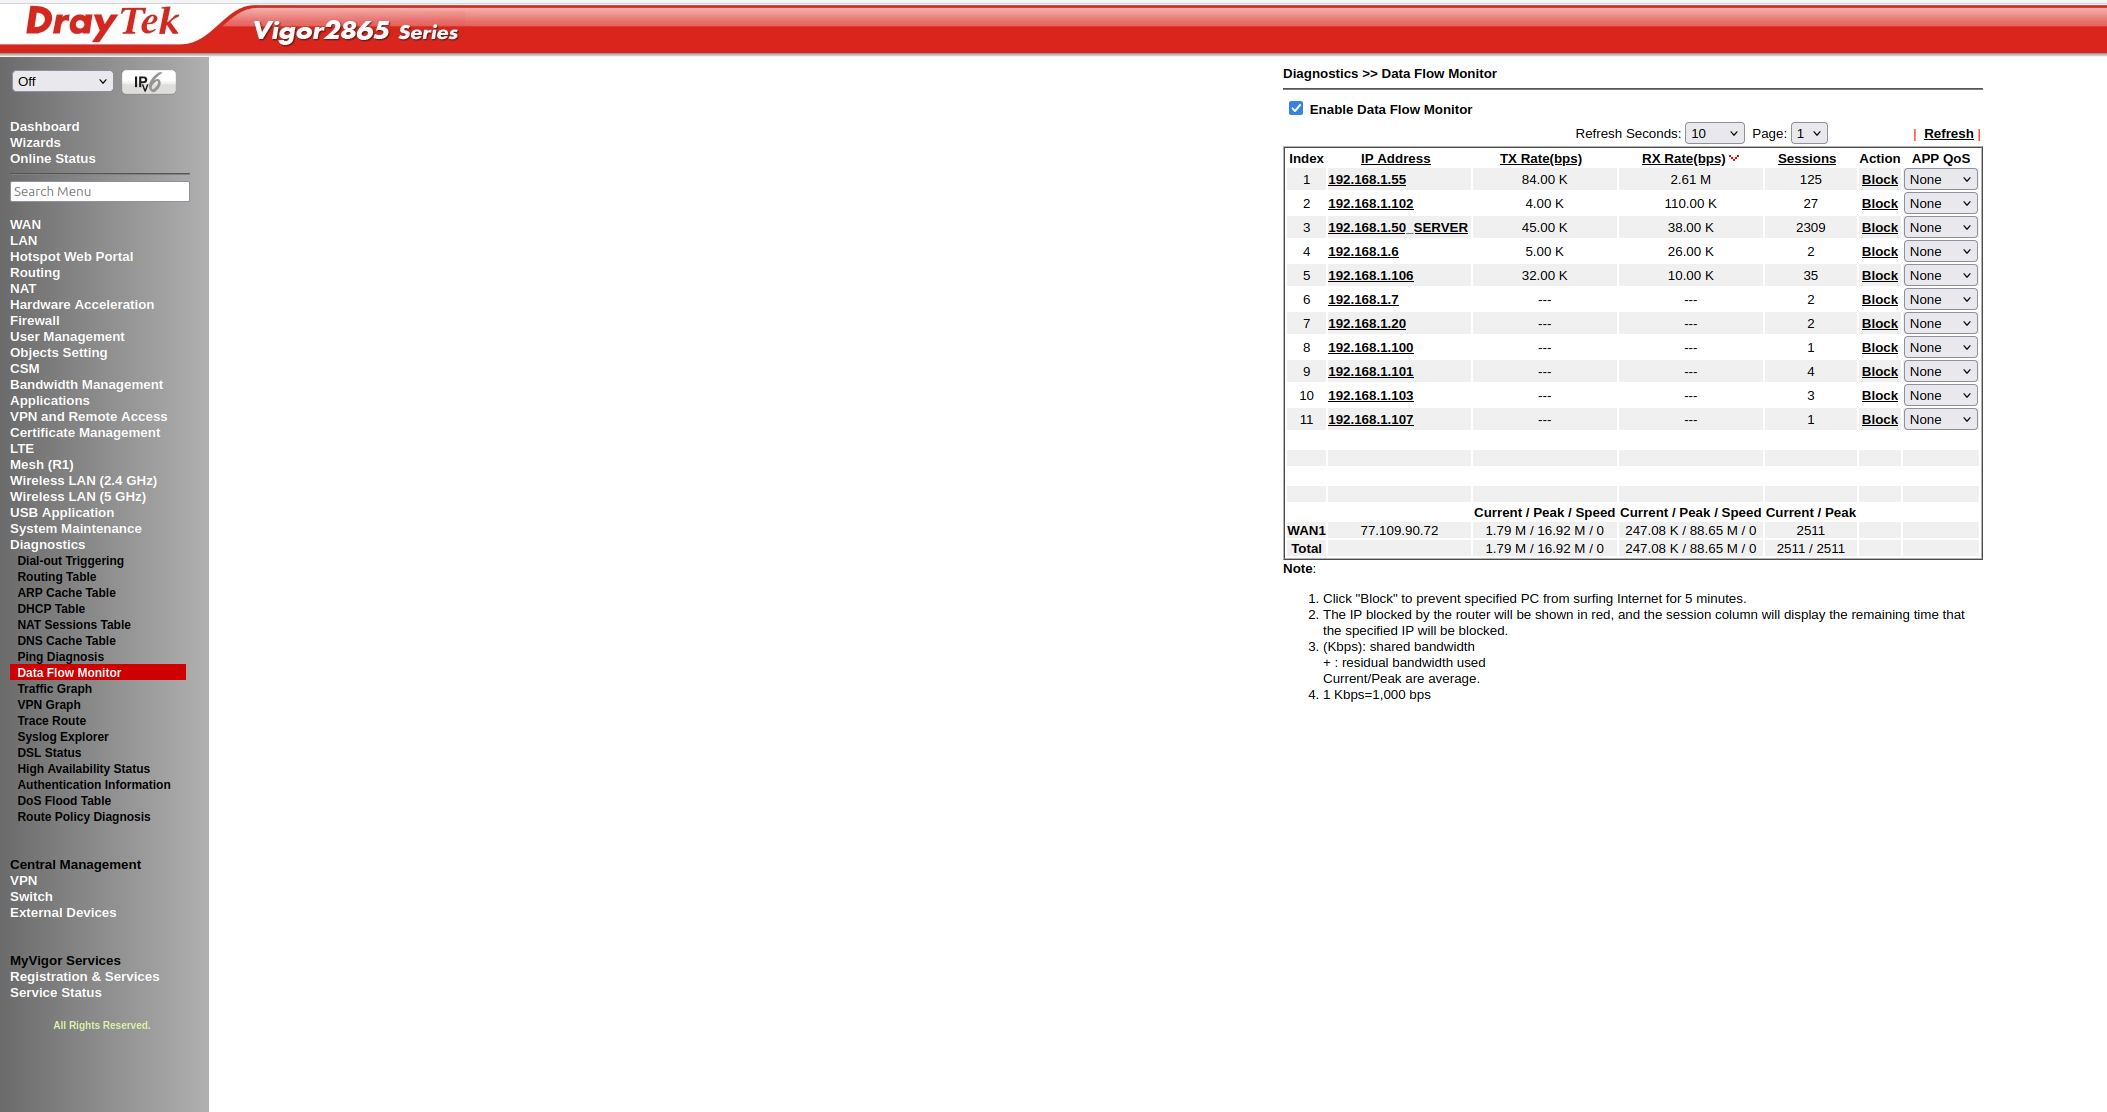
As I have a new router, DrayTek and it CAN handle the requests, where the Fritzbox failed.

2 monitors in production, like the new system a lot!

But 1 remark, I tried to install from the github, but the apt-source was missing, maybe a good idea to link to it or mention it in the readme. Other then that, great job!:ok_hand:

DrayTek seems to handle the load fine….where the Fritzbox started to crawl within the hour of running.

But then, these are not simple home-grade-routers :rofl:

1 Like

I’m using a MikroTik RB3011 router myself for the NTP in Leuven, Belgium. It can do 2 million pkts/s with connection tracking. MikroTik has a so-called fasttrack function that offloads most of the network stack to hardware. As of now, my NTP does on average 1500 pkts/s so that’s “pocket change” :smile:

1 Like

Are you running this sever by any chance?

BTW, ntp.oma.be seems to have put all severs in a pool, like I do with ntp.heppen.be

nslookup ntp.oma.be
Server: 127.0.0.53
Address: 127.0.0.53#53

Non-authoritative answer:
Name: ntp.oma.be
Address: 193.190.230.106
Name: ntp.oma.be
Address: 193.190.230.105

Yes, that’s my NTP. I was wondering whether the oma ntp was undergoing maintenance or had other problems. Will update the config.

Seems Oma blocked the access to their Stratum1 servers, I tried to acces them but got thrown out.

So I switched to their pool.

I’m getting KoD from the second Oma server. chrony can’t use it at all, and no, nothing’s wrong on my side. The first Oma server has no issues.

Weird, as they both work fine here:

Last login: Sun Aug 31 17:43:03 2025 from 192.168.1.101
root@server:~# chronyc sourcestats 
Name/IP Address            NP  NR  Span  Frequency  Freq Skew  Offset  Std Dev
==============================================================================
GPS                         6   5    18   -560.883   3089.430  +4499us  5256us
PPS                        37  17    72     -0.002      0.298     -1ns    10us
ntp0.nl.uu.net             15   9  275m     +0.132      0.039  -1389us   166us
ptbtime1.ptb.de            17   6  293m     +0.098      0.175  -3477us   954us
ntp-public-2.oma.be        11   7  241m     +0.138      0.042  -2321us   122us
ntp-public-1.oma.be         7   5  138m     +0.103      0.106  -2054us    92us
root@server:~# chronyc sources
MS Name/IP address         Stratum Poll Reach LastRx Last sample               
===============================================================================
#- GPS                           0   2   377     2  +7293us[+7293us] +/-  111ms
#* PPS                           0   1   377     2  +1102ns[+1232ns] +/-   27us
^- ntp0.nl.uu.net                1  10   377   565  +1021us[+1083us] +/-   10ms
^- ptbtime1.ptb.de               1  10   277   22m  -4957us[-4812us] +/-   16ms
^- ntp-public-2.oma.be           2  10   377   517  -1304us[-1249us] +/-   34ms
^- ntp-public-1.oma.be           2  10   377  1018  -2303us[-2188us] +/-   36ms

But then, I do not poll other sources that often, there is no use for it.

My setup:

# GPS time.
refclock SHM 0 refid GPS poll 2 precision 1e-3 offset 0.070 delay 0.2
refclock SHM 1 refid PPS poll 1 lock GPS precision 1e-8 maxlockage 64 prefer
#refclock PPS /dev/pps0 lock GPS refid PPS poll 1 precision 1e-8 maxlockage 64 prefer

#You do need to talk to an NTP server or two (or three).
server ntp0.nl.uu.net
server ptbtime1.ptb.de
pool ntp.oma.be

Beware, I use an RS-232 GPS, so I poll a bit faster, but just to show my workings.

I’ve observed a large number of “local-check failure” related warnings in the ntppool-agent log, as well as occasional “local clock might not be okay”.

I think the reference time source used by the ntppool-agent is too far away from my location.
Is it possible to adjust the max offset limit based on the latency instead of hard-coding it to 10ms?

I did notice the use of some reference serverson the other side of the world from me, and most are in Europe. Among the servers used, the one at Cloud Flare is any cast, so the NTP request is routed to a nearby server. Perhaps additional any cast servers that do not do leap second smearing should be used, such as the one at Apple, so that more nearby reference servers are used.

Those “local clock might not be okay”, are those for a production or test monitor? IPv4 or IPv6? Because oddly enough, on my own “remote” monitor I get those warnings only for IPv6 and almost exclusively for the test monitor. My /var/log/messages started yesterday at midnight and there are now 451 entries for “local clock might not be okay” for env=test ip_version=v6, but only 1 for env=prod ip_version=v6, and none for ip_version=v4.

These are the typical numbers for a production and test local checks:

msg=local-check env=prod ip_version=v6 failures=2 threshold=3 hosts=8

msg=local-check env=test ip_version=v6 failures=5 threshold=4 hosts=9

Note that even though 3 failures out of 8 (prod) is a tighter requirement than 4 failures out of 9 (test), I still get more “local clock might not be okay” errors for the test environment. Maybe the pool of reference NTP servers from which the reference time sources are picked is different between production and test.

Here are my top offset reference clock entries:
grep “offset too large” messages | grep env=test | grep version=v6 |cut -d" " -f11 | sort | uniq -c | sort -rn

711 server=uslax1-ntp-004.aaplimg.com
711 server=time.apple.com
677 server=ntp.nict.jp
520 server=twtpe2-ntp-001.aaplimg.com
424 server=sesto4-ntp-002.aaplimg.com
177 server=ntp.se
 19 server=time.google.com
 11 server=ntp.ripe.net

This issue only shows up on my most distant monitor in Australia. The others do not have any “local clock might not be okay” entries in their logs.

Otherwise I’d chalk this up to bad routing at my provider, but the stark contrast between production and test environment results suggests otherwise.

Most of the warnings come from prod and ipv4, I agree that this is related to the network environment.

level=WARN msg="local-check failure" env=prod ip_version=v4 server=tock.ucla.edu ip=164.67.62.199 err="offset too large: 13.164934ms"
level=WARN msg="local-check failure" env=prod ip_version=v4 server=ntp1.net.berkeley.edu ip=169.229.128.134 err="offset too large: 11.594985ms"
level=WARN msg="local-check failure" env=prod ip_version=v4 server=usscz2-ntp-002.aaplimg.com ip=17.253.16.253 err="offset too large: 15.963879ms"
level=WARN msg="local-check failure" env=prod ip_version=v4 server=ntp.stupi.se ip=192.36.143.153 err="offset too large: -36.914252ms"
level=WARN msg="local-check failure" env=prod ip_version=v4 server=ntp.ripe.net ip=193.0.0.229 err="offset too large: -30.735914ms"
level=WARN msg="local-check failure" env=prod ip_version=v4 server=time.fu-berlin.de ip=130.133.1.10 err="offset too large: -35.146165ms"
level=INFO msg=local-check env=prod ip_version=v4 failures=6 threshold=5 hosts=12
level=INFO msg="local clock might not be okay" env=prod ip_version=v4
level=INFO msg=local-check env=prod ip_version=v6 failures=0 threshold=3 hosts=8

I’ve observed offsets between +15ms and -38ms, and the target server’s latency is between 180ms and 240ms. I think the offset is normal for this latency.

If the upper limit isn’t determined by latency, I think 50ms is an acceptable value for my environment.