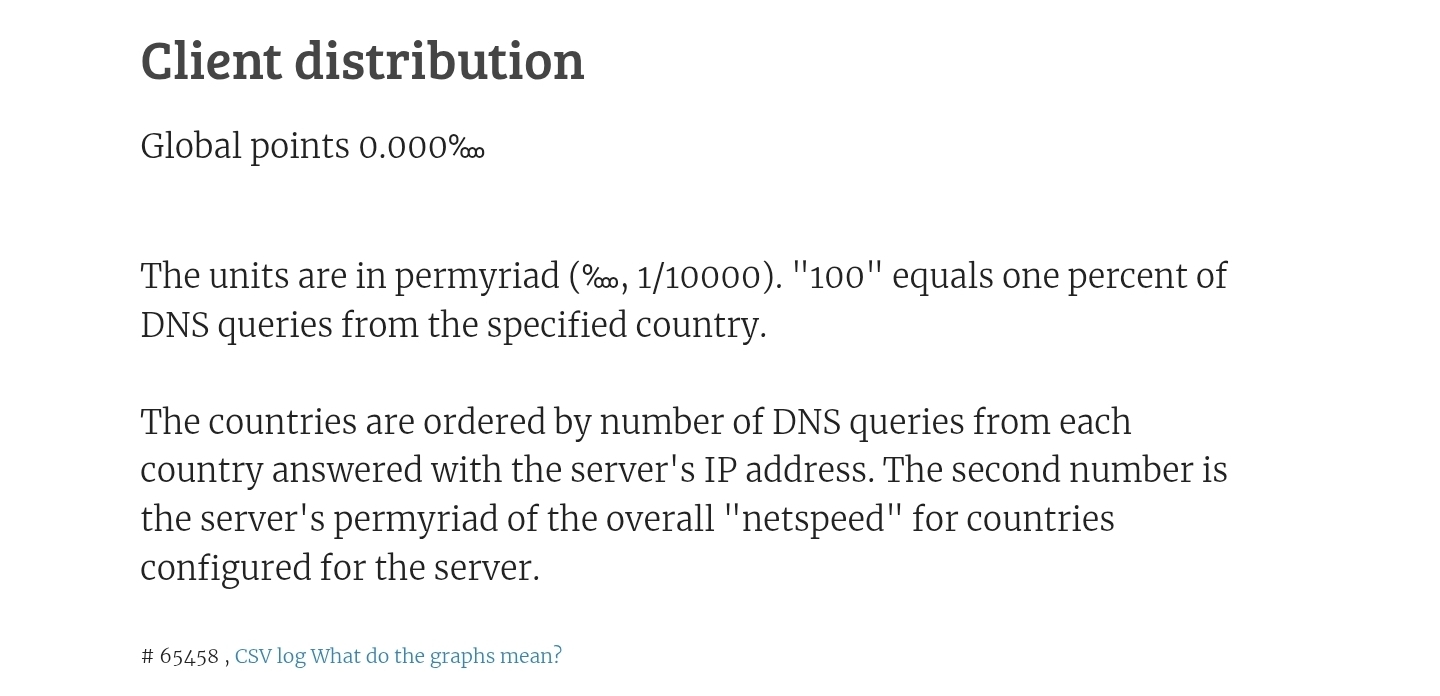
hi everyone, for some days now I have noticed, that my client distribution shows absolute zero even if my score is 20 from all relevant monitors. Have I missed something? Or do I need to do some changes in settings?
Thanks
hi everyone, for some days now I have noticed, that my client distribution shows absolute zero even if my score is 20 from all relevant monitors. Have I missed something? Or do I need to do some changes in settings?
Thanks
That goes hand in hand with the DNS query graphs on the status page no longer showing any data. It seems that DNS data is no longer entering the respective pipelines, thus data for the “Client distribution” table has been slowly sliding out of the three day window of data considered for this table.
As interesting side effect, I did observe countries listed for some of my servers that the server is not registered in, but countries it is registered, and where it sees most traffic, not listed anymore, e.g. for a server in Australia:
us  8.84 ‱
ch  156.25 ‱
Or unusually “round” values, e.g.:
id  500.00 ‱    794.78 ‱ (0.63x)
my  2500.00 ‱   1393.70 ‱ (1.79x)
I have sent e-mails to @ask about both symptoms.
Same here, no numbers, just checked also.
And just to add https://www.ntppool.org/dns.html also shows “0 queries” for each server.
The DNS data shown on an NTP server’s page is flowing through the infrastructure, and it seems something in the pipeline is currently broken so the data doesn’t reach the API anymore from which the JS code on the page picks it. Similar with the graphs on the system status page.
The data on the DNS server status page on the other hand is pulled by the web server directly from the DNS servers, it’s not flowing through any other parts of the infrastructure. And the DNS servers simply do not provide that data (anymore?). I.e., this seems to be intentional, not some bug/temporary breakage. So just like with the “DNS query rate graphs” link at the bottom, an update of the page template would be needed to reflect that.
Same here. Is there something I can/should do?
With monitoring on I see many request coming in so everything works.
Numbers are back 
I’ve encountered the same problem and would like to know how to solve it. I’d like to know if my server is still providing time synchronization services in this situation.