I mean, I have a monitor (IPv4 and IPv6), they constantly monitor well on my other NTP servers that are all over Europe.
However, I see a few other monitors that are real poor for all my servers.
Wouldn’t it be a good idea to score the monitor itself?
I mean, if a monitor keeps persistently mark servers as bad but others don’t, be a good idea to inform the monitor operator to rethink if his monitor is being useful?
Nobody benefits from poor performing monitors. If mine would perform badly all the time, I would remove it.
Rate it just like you do NTP-scoring, but then on their testing performance compared to other monitors.
I mean, you see their scoring numbers, if they are not on par with other monitors and it happens a lot, it may be a good reason to remove them.
The new scoring calculation is called recent median. It works simply by choosing the median score of the ‘1-scores’ from “active” monitors in the last 20 minutes.
Even after the Sunday bugfix I’m still getting continual emails telling me about “Problems” and wacky low scores.
Historically my server (71.191.185.32) always was about 4ms +/- 2ms offset from the San Jose monitor and only in cases of complete loss of connectivity did it get a negative score and get removed from the pool.
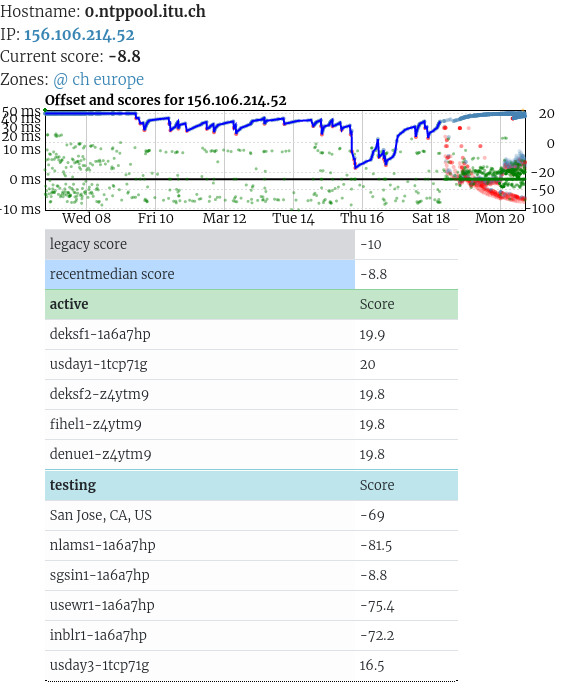
It is interesting to look at the new graph and see that the green dots (offsets) have become much denser, and drifted on average much closer to an average of 0ms offset (with still several ms of scatter).
At same time there are all kinds of red dots that I think are individual (new) monitor scores that seem to be dominating the results (which might be the “median” - assuming that the red dot is a score and not an offset!).
It is not at all obvious how I can map the server names such as “nlams1-1a6a7hp” to a geographic location.
I had never seen red dots on the monitoring history graph before I and don’t know what they mean.
Has there been a change for what an “acceptable offset” is? Again all my green dots recently seem to be +/-10ms.
I suspect that the nlams1 server is in Amsterdam, the Netherlands (hence nl ams).
Could it be that the physical distance to your server (i assume is in US) causes these low scores?
Most server names seem to tell me what their physical locations are:
sgsin1: Singapore?
inblr1: India?
deksf1: Germany or Denmark?
fihel1: Finland?
BTW: isnt it funny that my server (which is in Netherlands), receives bad scores from some monitors in the US?
Just a side note:
The “code” represent the country (first two letters) followed by a three letter IATA-Code (airport code) closed to the GeoIP location.
While setup a monitor the system will do a geoip lookup and report the nearest airport location(s). If the GeoIP DB is not correct the location will also bad.
That is kind of the point of multiple monitors though, to show how different internet routes affect traffic. To say only good scoring monitors can be used defeats the purpose. Sure there can be bad monitors that score nothing good, but the point is to have multiple monitors from all over testing to eliminate the just your server is bad here so it’s bad everywhere issue. In other words you can’t rate monitors the same as we expect to see different scores on different monitors, it’s kind of the point.
I have noticed since we have more diversity in monitors that Verizon FiOS accounts are having more issues. Could be upstream issues with the connection to Verizon, if it helps here is a traceroute to port 123 over udp from usday3 and we are not seeing a response from the next hop where we should at 152.179.136.9 from Verizon:
The system does have a function to use server/monitor pairs that are more successful (see the “selector” section in the documentation linked above). It didn’t work because of a bug (now fixed in v3.4.0)
Hello, I have two NTP servers in Taiwan, Asia, using the Taiwan Hinet and Seednet networks respectively. I am interested in joining the new monitoring network. Is it still possible to join now?
The denser dots are just an artifact of how the graphing works. There are many more monitoring “points” now. As the old data rolls off it should show a shorter time period with slightly less data. (I’d love to fix this, but it’s temporary and I probably wouldn’t figure out the javascript before it’s sorted by itself …).
The red dots are when the score drops significantly (typically from an i/o error / timeout). See my next post for more on this!
The monitor names are [two letter country code][airport code].
The acceptable offset is currently 75 ms (!). With the improved monitoring system we can probably make this smaller.
Thanks everyone for your patience with this rolling out!
I found a bug in the monitoring client that I’d introduced in an unrelated change a late Sunday evening a couple months ago. We missed it in testing because most of the beta monitors never got that particular version.
In each test the monitor sends multiple “probes” to a server. The intention is that it picks the best response it gets as the monitoring result. The bug I introduced made it so if any of the probes had an error the whole result got marked with that error, rather than ignoring it in favor of a successful response.
it’s fixed now and the monitors run by the project have been updated. The other monitors should get updated in the next ~12 hours or so.
deksf1 is in Germany. Denmark would be a ‘dk’ prefix.
During testing and the last few days of looking at graphs I’ve seen so many examples of different monitors seeing very different (and very consistent) offsets. I haven’t seen any clear patterns of some monitors consistently working well for everyone and many examples of the same monitor getting “crazy” results for one server and excellent results for another. There might be some confirmation bias, but I think it validates the new design with the many monitors and the system trying to choose which to focus on.
Indeed – the code that generates the location code options is here.
I’d like the monitor to have a traceroute feature built in and occasionally send traceroute data to the monitoring API to help on this sort of thing.
Over the weekend I added (made public) my ntp server, the monitoring results are erratic and unstable. To be honest I can’t believe it is that worse, pinging from an out of country gives perfect results.
Thanks @ask for jumping on this and troubleshooting it so quickly. My scores have started to stabilize and my servers are starting to spend time in the pool again. If you need anything else from me let me know. If you need another US monitor, I’m willing to volunteer for that as well.
No it’s not that. The red dot by the ‘T’ of Tue represents an offset of 2000ms, which is why the score dropped 5 points. It looks like just the last two digits of large offsets are being drawn on the axis label.